The next version of DAX Studio has just been released and you can get it from the home page at https://daxstudio.org
This release has actually ended up to be a bit larger than originally planned, but hopefully this means there will be something in here for everyone.
In addition to a number of bug fixes and smaller improvements, this version includes the following major features:
- Resilient Connections
- Native Excel output
- Clipboard results target
- New Options layout
- View Metrics improvements
- Query Builder improvements
- Prompt before refreshing metadata
- Export Data improvements
Read on for more detail about each of these.
New Features
Resilient Connections
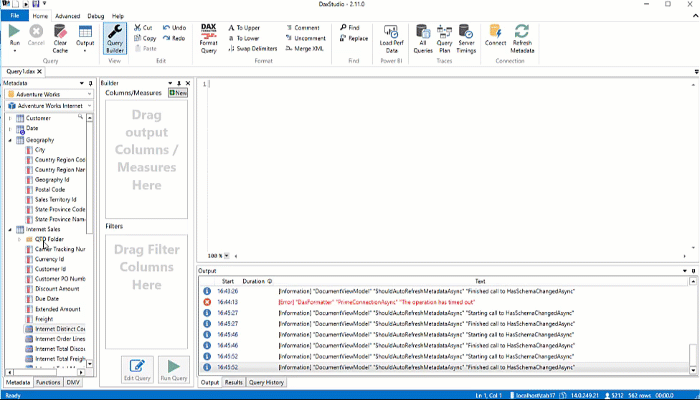
This is one of the bigger features that hopefully no one will notice. I spent a few days re-architecting the internals of the connection management so that now every tab has it’s own ConnectionManager object and if a connection is broken for any reason the ConnectionManager will automatically attempt to re-connect to the same data source and database. This is particularly an issue for Azure Analysis Services and the XMLA endpoint for Power BI Premium where backend operations like deployments, scaling and model synch operations can cause sessions to be dropped. Whenever the connection is retried for any reason you will see a warning in the Output pane like the following.
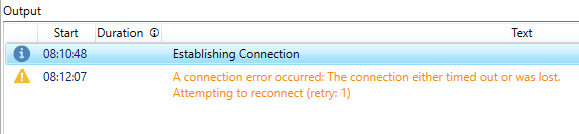
If you see one of these warnings while you are doing anything involving performance tuning you should re-try the previous operation because at least part of the time would have been taken up by re-connecting to the data source.
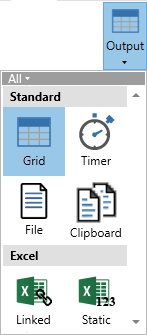
Native Excel Output
As of v2.13 you can now output directly to a static XLSX file from the standalone version of DAX Studio (so no need to launch from the Excel add-in just to output data directly to an XLSX file). The existing csv export format was specifically optimized to work well in Excel, but I have heard that in the past people were sometimes using the Excel addin just to get output into a native Excel file. In addition this should be much more efficient on memory usage as the data gets streamed directly to the file and you do not need have to have Excel running.
To keep in synch with the Excel addin I have also added a “Linked” Excel output. This basically generates an ODC file with an embedded DAX query.
I had previously held off from implementing a native export to Excel as there was no good solution that did not involve generating the Excel file in memory before saving it to disk. But thanks to a new library called LargeXlsx it’s now possible for me to generate potentially huge files while maintaining a low memory footprint.
Although note that Excel files still cannot exceed 1 millions rows. That limitation is built-in to the file format.
Clipboard Output Target
In addition to the new Excel result targets we now also have a Clipboard target. When using this the results of any queries are sent directly to the Windows clipboard where you can paste them into another application.
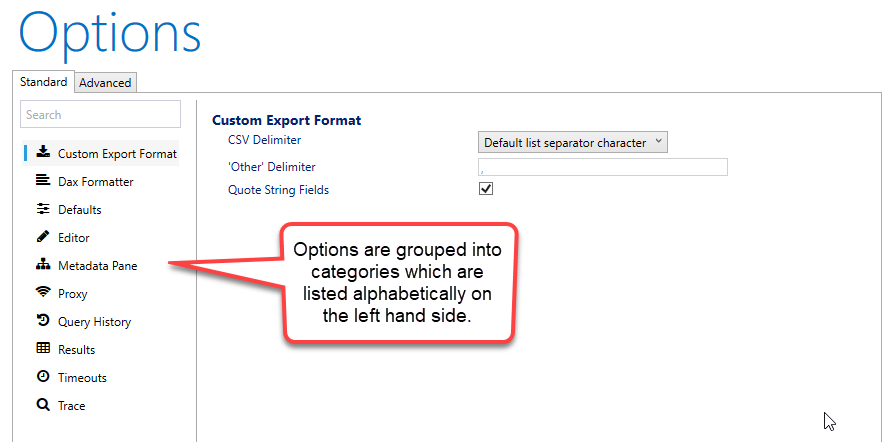
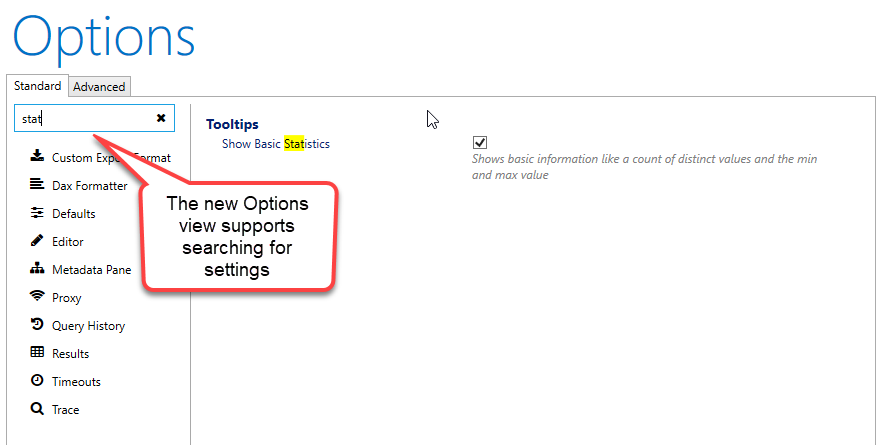
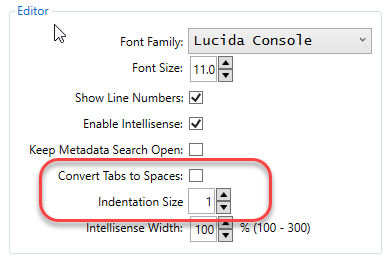
New Options layout
Over the years I’ve added numerous settings to the options page in DAX Studio, but it’s now at the point where having everything visible on the one page does not work and it’s just too hard to find things. So I’ve re-built the Options page using a new framework that organises the settings into categories which can easily be browsed through and searched
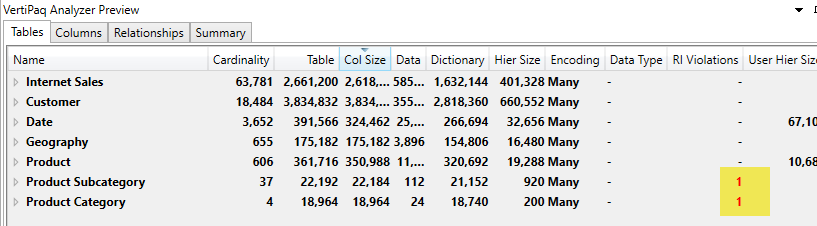
View Metrics Improvements
There have been a number of small improvements to the View Metrics functionality in this release including:
- Added a Loading indicator. There was one in the status bar, but the Metrics view has been aligned to show the same sort of “busy” overlay as the other windows do.
- Fixed Sorting in View Metrics table view to do a nested sort and to sort Descending on first click
- View Metrics – Fixed KB/MB/GB (it was lowercase, which is for bits not bytes)
- Added Tooltips to most of the columns
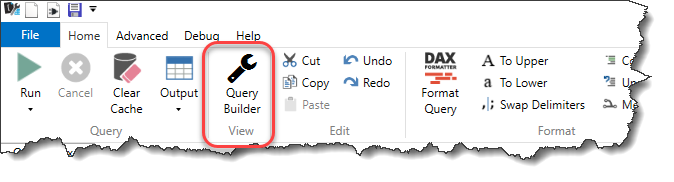
Query Builder Improvements
The original filter patterns used by the query builder were copied from queries generated by Power BI Desktop and were in the form of
FILTER( KEEFILTERS( VALUES( <column> ), <condition> ))
this has been improved to produce more efficient queries with the following pattern
KEEPFILTERS( FILTER ( ALL( <column> ), <condition> ))
The Query Builder now also supports BETWEEN filters for dates and numeric columns and IN and NOT IN lists for text columns.
Prompt before refreshing
There is now an additional option in the automatic metadata refresh where you can ask DAX Studio to prompt before refreshing.
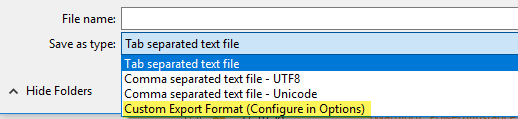
Export Improvements
The Data Export feature will now check if the data source supports the TOPNSKIP function and will use that if possible to export data in batches of 1 million rows at a time. This should allow us to export massive data volumes without triggering out of memory errors. I was able to do a test exporting 120 million rows from Power BI Desktop which generated a 20 GB csv file on my laptop (with 16 GB of RAM) and during the export Power BI stayed at around 1 GB of memory usage and DAX Studio hovered around 300 MB of memory usage.
Miscellaneous
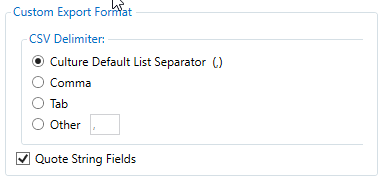
The default file export format has been changed to csv instead of tab delimited since csv is probably a more common format and handles things like embedded line breaks better.
Fixes
- Fixed #400 duplicate New option in customize Quick Access Toolbar
- Fixed #401 unable to re-show Power BI Performance window after hiding it
- Fixed #405 / #419 incorrectly trying to write external tools file when doing a non-admin install
- Fixed crashes when right-clicking on certain tool windows
- Fixed #411 Export to csv not quoting strings
- Fixed #404 improved code completion interactions
Recent Comments