Field Parameters are a relatively new feature in Power BI which are still in preview and they add a lot of flexibility to an interactive reporting solution, but can they be used in paginated reports?
The short answer is yes, but the experience is not as simple as it is in Power BI Desktop. The reason for this is that Power BI Desktop does not just pass field parameters as filters to other visuals, they actually change the way the underlying DAX queries are generated.
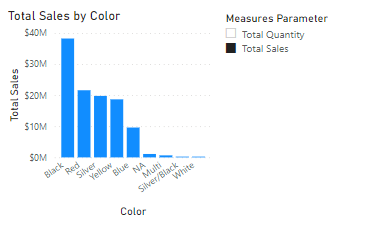
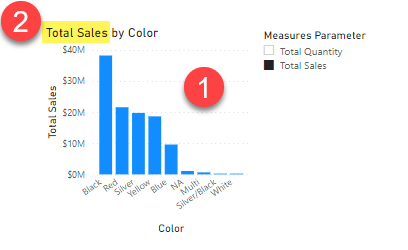
The following example of an Adventure Works based report with a field parameter that allows the user to choose between showing either the Total Sales measure or the Total Quantity measure.
If we use the Performance Analyzer in Power BI Desktop to capture all the queries for this page we find 2 sets of queries.
The first one for the slicer looks as follows and just gets a list of values from our Field parameter table:
// DAX Query
DEFINE
VAR __DS0Core =
SUMMARIZE(
VALUES('Measures Parameter'),
'Measures Parameter'[Measures Parameter Fields],
'Measures Parameter'[Measures Parameter Order],
'Measures Parameter'[Measures Parameter]
)
VAR __DS0PrimaryWindowed =
TOPN(
101,
__DS0Core,
'Measures Parameter'[Measures Parameter Order],
1,
'Measures Parameter'[Measures Parameter],
1,
'Measures Parameter'[Measures Parameter Fields],
1
)
EVALUATE
__DS0PrimaryWindowed
ORDER BY
'Measures Parameter'[Measures Parameter Order],
'Measures Parameter'[Measures Parameter],
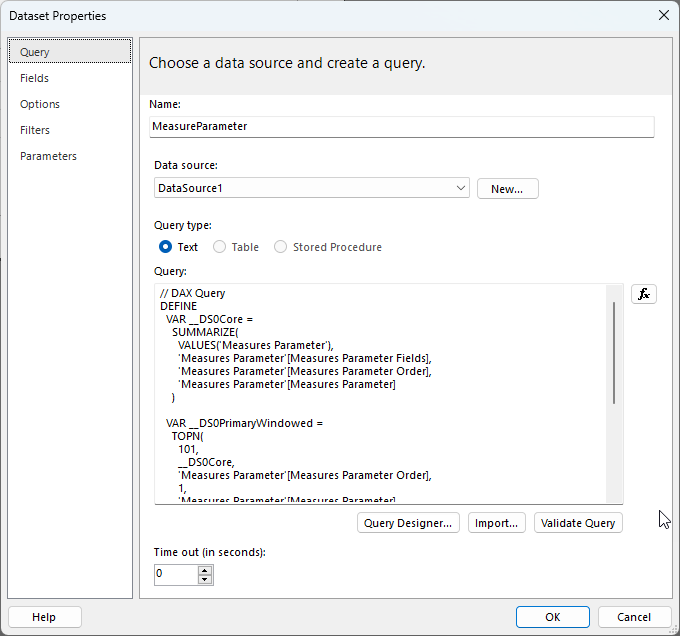
'Measures Parameter'[Measures Parameter Fields]To start integrating our Field Parameters into our paginated report we can create a new paginated report using Power BI Report Builder and we can copy and paste this query into a new dataset. I’ve called this dataset “MeasureParameter” in the screenshot below:
We can then create a new report Parameter linked to this dataset. I’ve called my parameter “MeasureName” and I’ve linked up the available values as follows:
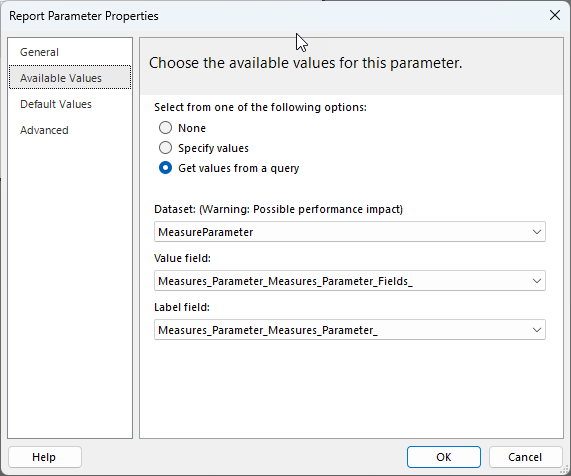
Note that I’m using the field for the Value property which returns the full DAX reference for the measure (eg. ‘Sales'[Total Sales]) and I’m using the display name of the measure for the label field (eg. “Total Sales”)
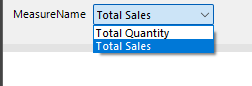
This will generate a parameter like the following when the paginated report is run to allow the user to select which measure to use:
If we then look at the second set of queries in the Performance Analyzer, we can see that the there are actually 2 queries.
- Gets the data for the chart and this query is dynamically generated
- Gets the name of the currently selected Field Parameter which is used to populate the chart title and axis labels
We can ignore query 2 as we already have the information about the field parameters in our MeasureParameters dataset, but how do we dynamically generate our query in the same way that Power BI does?
The answer to this is using expressions. Paginated Reports are extremely powerful in this regard and almost all of the properties of the objects in a report can set using expressions – even the query text and that is what we are going to do in this case.
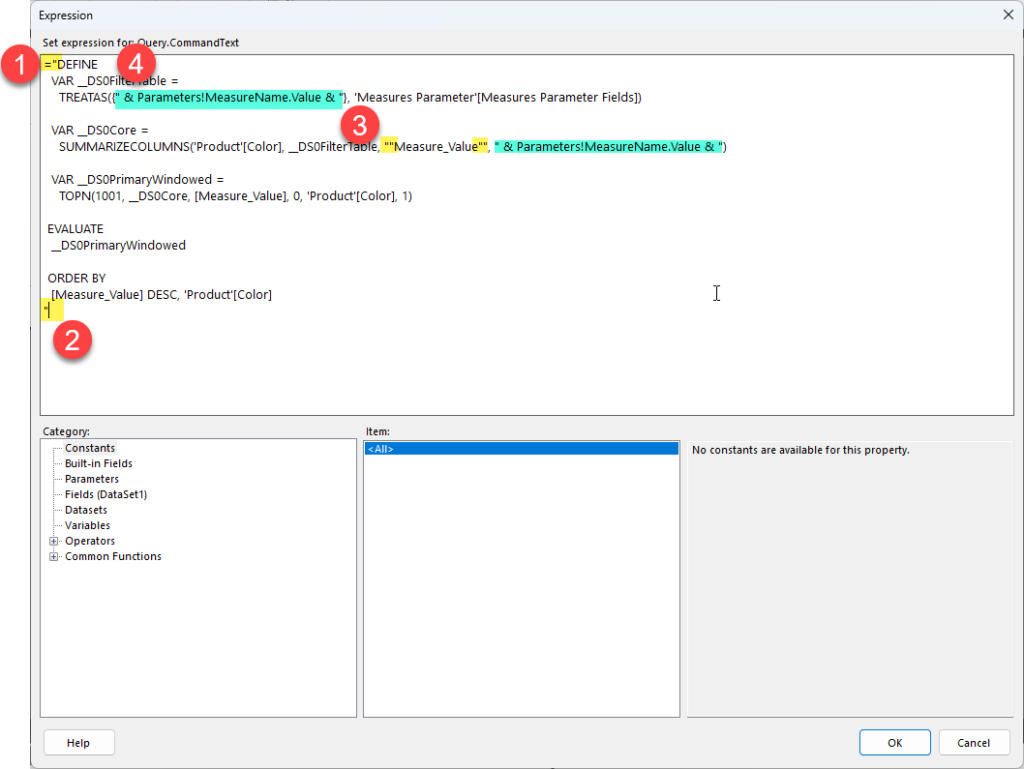
If we look at the text of the first query we captured from Performance Analyzer, it looks as follows:
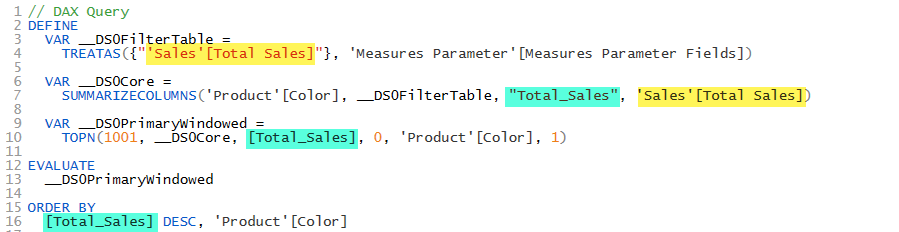
Where you can see on lines 4 and 7 that the ‘Sales'[Total Sales] measure is referenced (which I’ve highlighted in yellow. And on lines 7, 10 and 16 that this is given a name of [Total_Sales] in the output from the query. The [Total_Sales] is just a column name in the results of the query and we could leave it as end users of our report will not see this reference, but I prefer to make it clear that this is may not always be the Sales measure, so I renamed it to [Measure_Value]
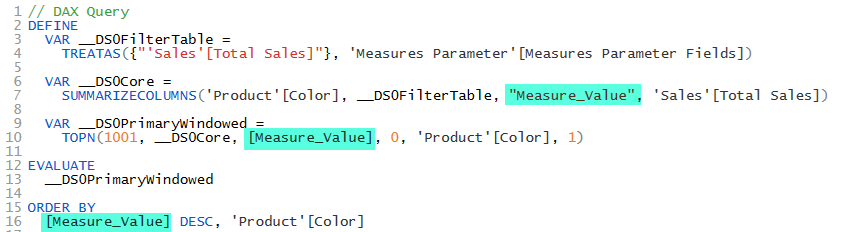
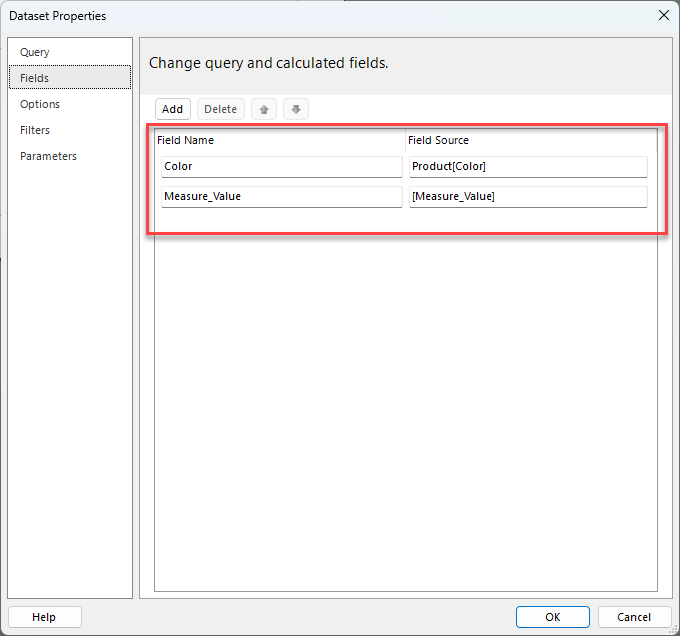
Then I created a new Dataset called “Dataset1” and pasted the above static query in and clicked “OK” this saves our dataset and generates the field mappings for us. (you can manually create the field mappings from the resultset to the paginated dataset, but I find this method of starting with a static query easier)
Then to make this query dynamic I clicked the “fx” button next to the Query property to open the expression editor.
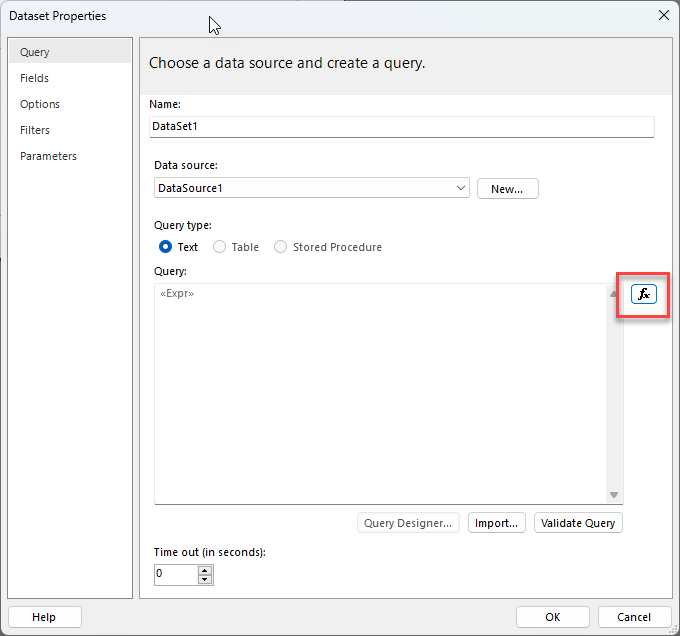
I then made the following changes to the query text:
- First, I started the expression with an = sign, this tells the report engine that this value needs to be evaluated as an expression. Then I added a double quote character as this is the start of a string expression.
- Then I added a closing double quote character at the end of the query.
- I then went through the rest of the query and doubled up any existing double quote characters to escape them.
- Finally, I inserted some concatenation expressions to add in the Value property from our MeasureName parameter which we added earlier using the Parameters!MeasureName.Value reference.
So, we now have a dynamic query which will inject the measure to be used based on the parameter chosen by the user at run time.
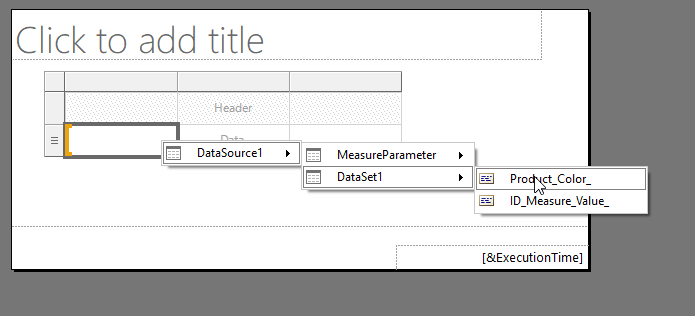
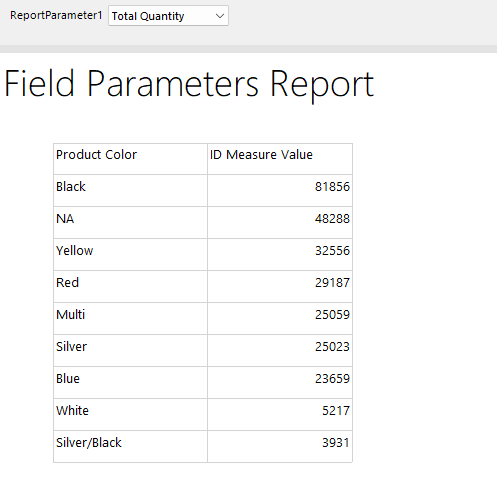
To test this we can put a simple table on our report canvas and link up the Color and Measure value fields
This gives us a table which looks like the following
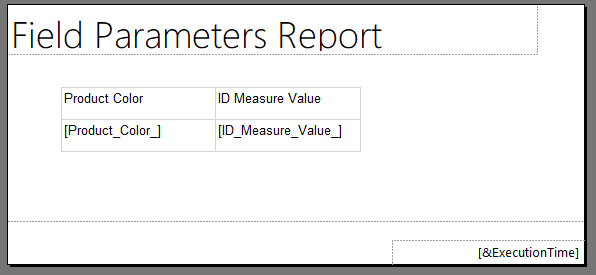
And when we run it and choose a measure from the parameter we get the data we expect, but we cannot easily tell from the report which measure was selected by the user since the column header just says “ID Measure Value”. So if this report was exported to a PDF or sent as part of an emails subscription it might be hard to tell which measure was selected.
To fix this we can right click on the “ID Measure Value” header and turn this column header into an expression instead of being static text.
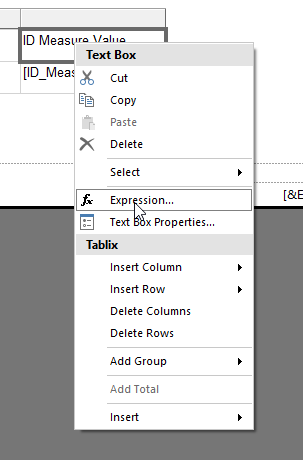
Then we can use an expression like the following to use the label of the selected parameter value as column header
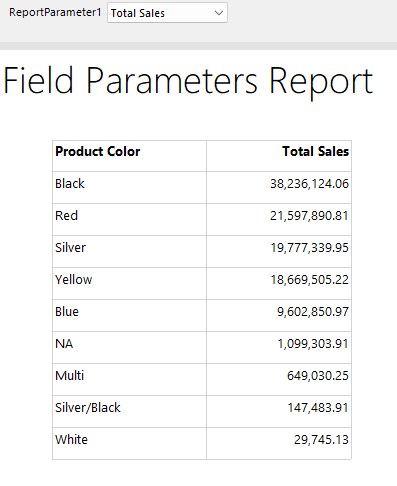
=Parameters!MeasureName.LabelIf we also bold the column headers, now when we run our report, we get an experience almost identical to that in Power BI Desktop and our table now shows which measure was selected in the header for the measure column.
This same technique of using an expression-based query could be adapted to work with field parameters that reference columns instead of measures. The expression for the query would just need to be adjusted differently, but I will leave this as an exercise for the reader.
Recent Comments