Currently Power BI does not support a way for dynamically setting a default value for a slicer using an expression. One common example of where this sort of capability would be really useful is if you have a dashboard that you want to default to show the current day’s data by default, but you want the user to be able to select a custom date filter if they so desire.
While I could go into my report and set a slicer to filter it for today’s date of 15 May 2023. When I open the report tomorrow this slicer will still have the hard coded value of 15 May 2023. You could potentially create measures that use something like: CALCULATE([Sales], 'Calendar'[Date] = Today() ) there are a number of problems with this. While it will automatically show the Sales amount for the value of Today() – the problem is that on the Power BI Service “Today” is set based on the UTC time. So depending on what timezone you are in the day can change part way through your working hours.
While there currently is no built-in way of configuring this within a slicer itself this there are workarounds and I’m going to walk you through one approach that I’ve used in the past. This approach has a couple of moving parts. The first one is that as part of a nightly data load process I update a number of columns in a shared “Calendar” table.
Implementation
In the example below I’ve added 3 indicator columns for IsToday, IsYesterday and IsCurrentMonth. This post was published on 15 May 2023 so for that date the IsToday column has a value of True.
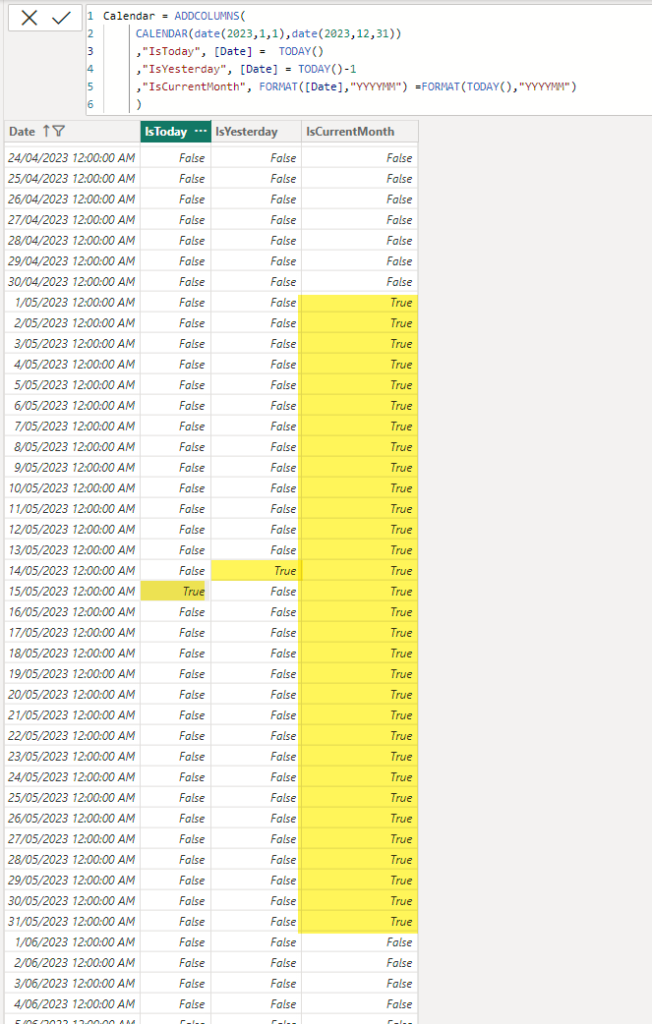
NOTE: I’ve simulated this in a simple Power BI example using a calculated table, but you need to be very careful using a calculated table in a production scenario since the Power BI service runs in UTC time so depending on when your data transforms get run your indicator columns could be updated incorrectly.
Once I’ve built out the body of my report, adding visuals and slicers I create 4 bookmarks:
- Custom Range – this has no report level filters and has my date slicer set as visible
- Today – this has a report level filter for IsToday=True and sets the date slicer to hidden
- Yesterday – this has a report level filter for IsYesterday=True and sets the date slicer to hidden
- Current Month – this has a report level filter for IsCurrentMonth=True and sets the date slicer to hidden
Then I add add 4 buttons to my report, one for each of the bookmarks above. Then as I click on each button it changes the filtering appropriately.
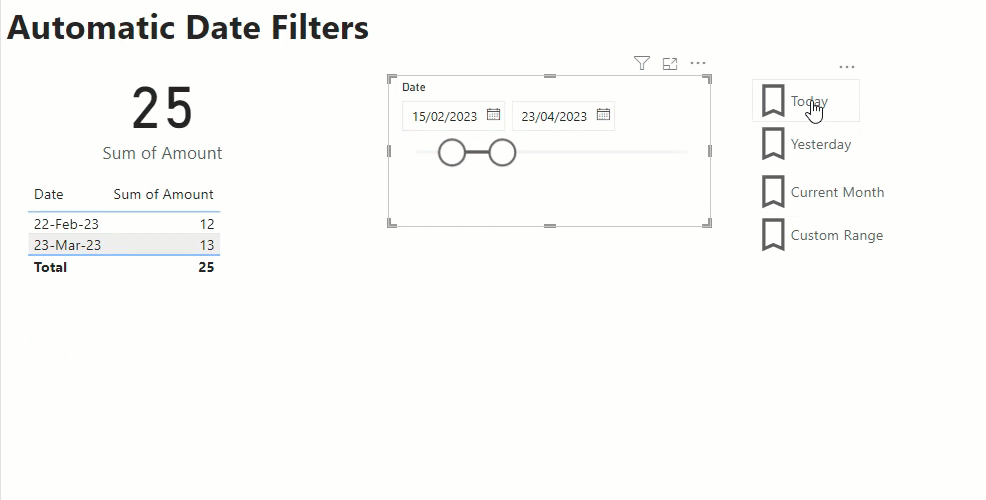
If I save and publish my report with the Today bookmark selected this means that each night when my data load routine is run, and my data model is refreshed the IsToday column is updated. Then the next morning when my users open the report they see the data automatically filtered for the current date. And if they wish to view some other date, I have a set of handy short cuts for common date filters, or they click on the Custom Range option to set their own custom filter.
Limitations
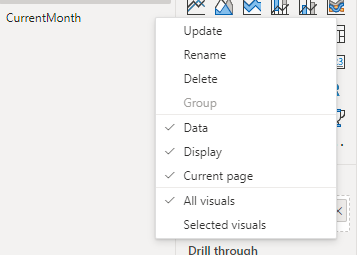
Where this approach falls down a bit is when you have multiple pages in your report, and you want the date filters to affect all the pages. For the indicator columns it’s easy enough to set the filters linked to your bookmarks as report level filters. And you can setup your “custom range” slicer as a sync’ed slicer so that it affects multiple pages. The tricky bit comes with the showing and hiding the slicer as you can only show and hide a visual on the current page with a bookmark.
The approach I chose to take was to make the “Custom Range” bookmark have the “Current page” option set so that the user was always returned to the first page in the report if they selected that option. It’s not ideal, but otherwise you would need different “Custom Range” bookmarks per page and it just gets a bit messy.
Recent Comments