The sample code in the blog post above is a full .net program that you could compile and run from Visual Studio or from the command line compiler. But that is something that not all BI developers are comfortable doing. If you are able to use Tabular Editor then there is a much simpler way to change this setting.
Launch Tabular Editor and connect to the XMLA endpoint for your workspace (so this requires a premium workspace).
Select the dataset you wish to test.
Paste the code below into the “C# Script” tab in TE2 or open a new C# Script document in TE3. The sample script sets the parallelism to 10, you can experiment with different values by changing the value in the last line of the script.
Then click the run button.
Finally click the save button to save this change back to Power BI
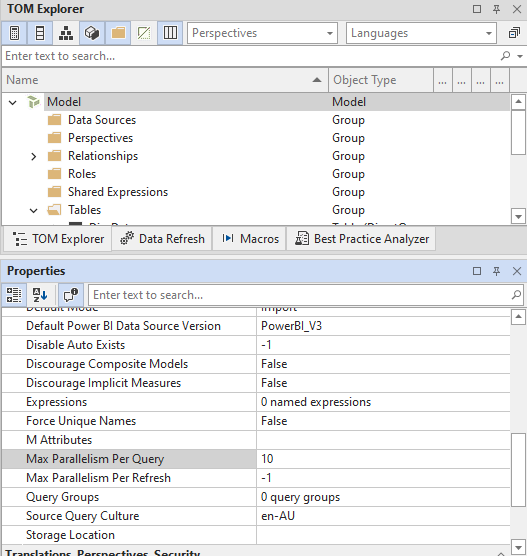
And once you have updated the compatibility setting of the database you can also change the Max Parallelism Per Query setting directly from the model explorer in Tabular Editor
In my previous post I had a short 40 line script for Tabular Editor (free | paid) which could generate descriptions for the measures in your tabular model. There were a number of interesting questions in the comments to that post which I thought would make a follow up post worthwhile.
Below is a very brief tutorial on running a script using Tabular Editor 2
If you launched Tabular Editor from the External Tools ribbon in Power BI desktop you can skip this step, otherwise click on this icon to connect to your data model.
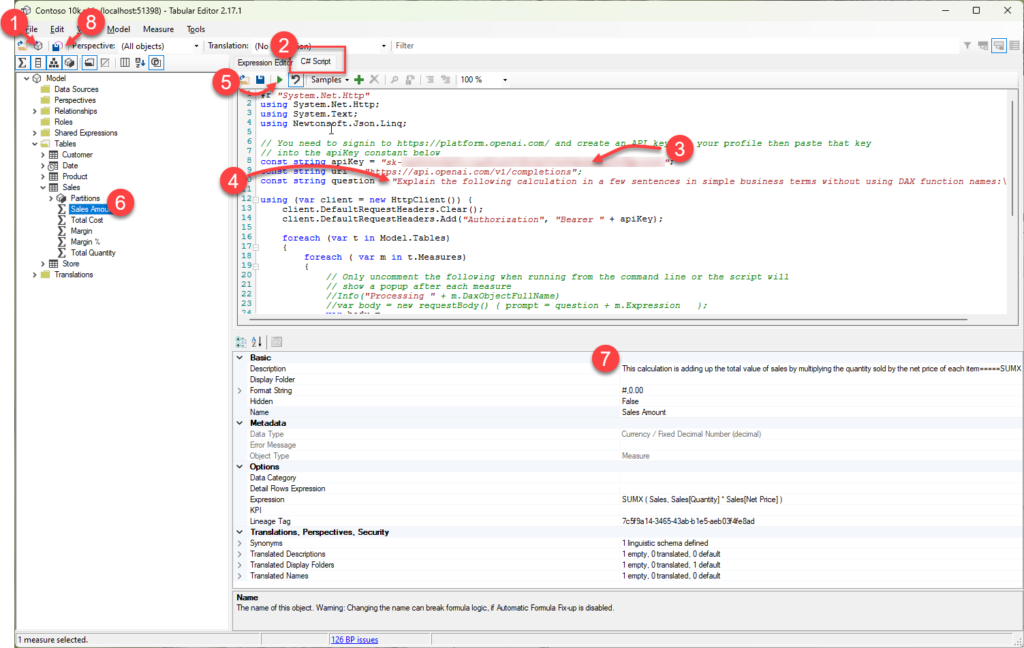
Click on the C# Script tab and paste in the script from my earlier post
There are instructions in my earlier post for requesting your own API key from Open AI you need to paste the key into this line between the quotes (“)
Optional: if you are targeting users that speak a language other than English you can update the question text on line 10 to your desired language (from what I understand ChatGPT understands about 100 different languages so you might need to test if this works in your language)
Click the play button to run the script, this step could take a while depending on the number of measures and whether you hit throttling (more on this below)
Once the script has run you can check some of the descriptions by clicking on a measure in the model explorer. At this point all the descriptions are still local and have not been saved back to your data model.
The text generated by ChatGPT will appear in the Description property for the measure.
If you are happy with the generated descriptions clicking the Save Changes button will save the new descriptions back to your data model.
How to run the script using TE3
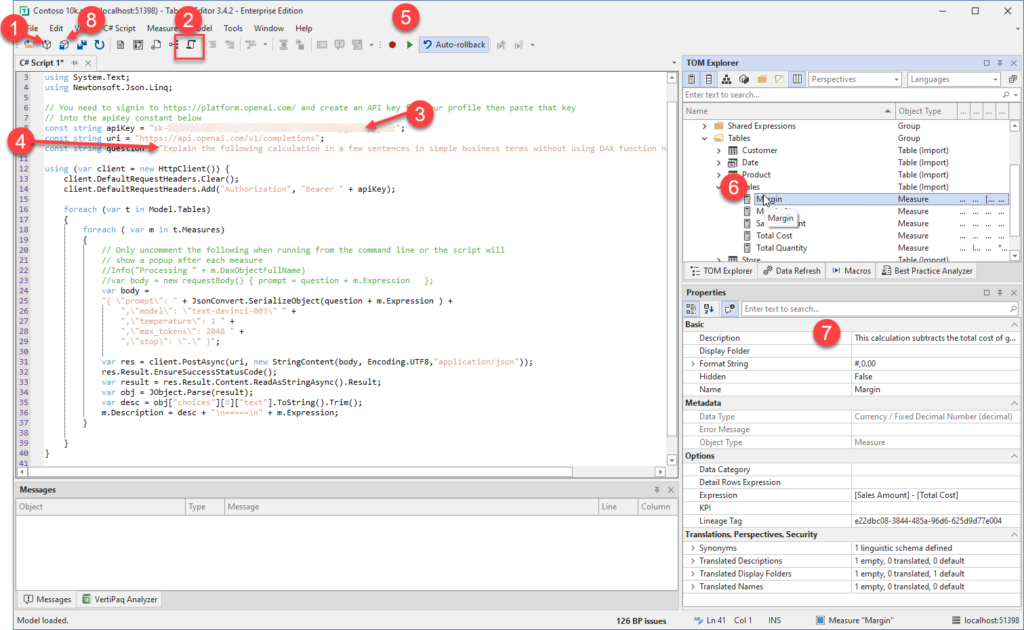
The steps for Tabular Editor 3 are almost the same with the main difference being at step 2 because TE3 allows you to have multiple C# scripts open at the same time.
If you launched Tabular Editor from the External Tools ribbon in Power BI desktop you can skip this step, otherwise click on this icon to connect to your data model.
Click on the New C# Script button to create a C# script document and paste in the script from my earlier post
There are instructions in my earlier post for requesting your own API key from Open AI you need to paste the key into this line between the quotes (“)
Optional: if you are targeting users that speak a language other than English you can update the question text on line 10 to your desired language (from what I understand ChatGPT understands about 100 different languages so you might need to test if this works in your language)
Click the play button to run the script, this step could take a while depending on the number of measures and whether you hit throttling (more on this below)
Once the script has run you can check some of the descriptions by clicking on a measure in the model explorer. At this point all the descriptions are still local and have not been saved back to your data model.
The text generated by ChatGPT will appear in the Description property for the measure.
If you are happy with the generated descriptions clicking the Save Changes button will save the new descriptions back to your data model.
Dealing with Rate Limiting
If you have not worked with API calls before you may not have come across the term “rate limiting” before. Basically, it is a mechanism that APIs use to prevent users from monopolizing the resources on a service by limiting the number of calls that can be made within a given timeframe.
In the case of the Open AI APIs they document their rate limits here and at the time of writing they only allow 20 calls per minute for a free account. Once you hit that limit the API will return a 429 error code which is a common code meaning “Too many requests”. There are 2 approaches that you can use to work around this.
You can add pauses in the code to wait until the next minute when you can then make another 20 calls.
You can upgrade to a paid account which has much a higher limit.
If you would like to see an example of an updated script which will skip measures which already have descriptions (so if you’ve manually updated some or if there was an issue part way through running a previous script
The Large Language Model (LLM) behind ChatGPT is an amazing piece of technology and it’s only going to get better over time. But I’ve also seen it described as “a B grade intern who hallucinates occasionally”. In it’s simplest form all these AI models do is to break a piece of text into a series of tokens and then predict what tokens are likely to come next based on a corpus of training material.
In my testing I’ve seen a number of examples where the prediction has missed some important detail. And in a couple of cases, I’ve even seen it include a modification to the original measure and then it has described the modified measure, not the original one!
So, while this is definitely a huge time saver, just be aware that it’s not perfect. Before publishing these descriptions into production, I would suggest doing a review of them to ensure that they make sense and include all the important details.
If you want to see all the descriptions at once you can use a tool like DAX Studio to run the following query to list them.
SELECT [Name], [Description], [Expression] FROM $SYSTEM.TMSCHEMA_MEASURES
Note: Make sure to go on and read part 2 after reading this which has some improvements to the script.
It seems like everyone is playing with ChatGPT at the moment and doing everything from getting it to write code for them to asking it to write ode’s to their favourite visuals. Writing DAX code is interesting from the perspective of someone building a data model. But one thing that has always been hard from the perspective of consumer of a data model is understanding the logic behind those DAX calculations.
As you’ve probably already guessed from the title of this post rather than generating DAX I wanted to see if we could go the other way and get ChatGPT to provide simple descriptions of what a DAX expression was doing.
To test this I did not want to use a basic measure, so I found a moderately complex expression that someone else had actually originally had ChatGPT generate for them and ask it to explain the calculation. The first time I tried this it produced a very long description breaking down each of the function calls. But by revising the way I asked the question I eventually got to a point where it was giving me a nice concise explanation.
When I posted the following question to ChatGPT:
Explain the following calculation in a few sentences in simple business terms without using DAX function names:
CALCULATE (
   SELECTEDVALUE ( 'Suppliers'[CompanyName] ),
   TOPN (
      1,
      SUMMARIZE (
         Products,
         'Suppliers' [CompanyName],
         "@StockValue", SUMX( 'Products'[UnitsInStock] * 'Products'[UnitPrice] ),
      [@stockValue],
       DESC
   )
)
It came back with the following answer which I was pretty happy with:
This calculation is finding the company name of the supplier with the highest total value of stock for a given product. It does this by first multiplying the units in stock by the unit price for each product, then summarizing that total value by supplier. It then finds the top supplier by that total value and returns their company name.
This was great for a single measure, but not all of the consumers of your data model will have access to view the DAX expression. And even if they did it would be a pain to have to keep jumping out to an external website to understand what every measure is doing.
So this made me wonder if there might be some way of injecting these descriptions into the data model. And as it turns out ChatGPT already has a REST API. All you need to do is to sign up for an account at https://platform.openai.com (if you’ve been experimenting with ChatGPT you probably already have an account) and then generate an API key for your account and you can make requests of ChatGPT from another program.
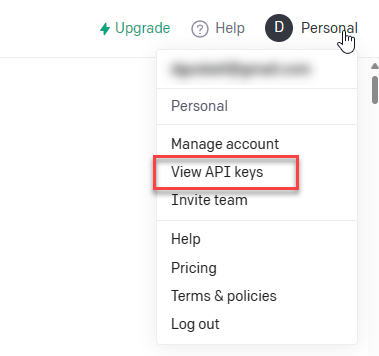
View and Create API keys from the account link in the top right corner
Note: free accounts are limited to 20 calls per minute (see Rate Limits – OpenAI API ). So for large models you would either need to add logic to include a 1 minute delay every 20 measures or upgrade to a paid plan.
From there I setup the following Tabular Editor script which will loop through all of the measures in your data model and update the description with the one generated by ChatGPT. All you need to do to run this is to paste your own API key into the apiKey constant on line 8.
For illustration purposes I’ve also included the original DAX expression, but you don’t need to keep that if you don’t want to.
The updated script including logic for dealing with rate limiting is included in my following post here
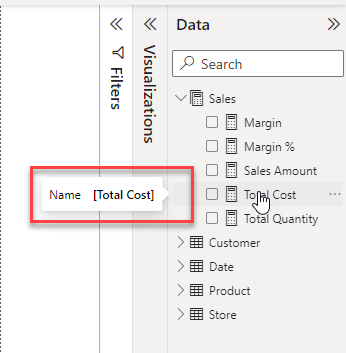
Before running the script hovering over a measure in my data model only shows the measure name
the default tooltip showing just the measure name
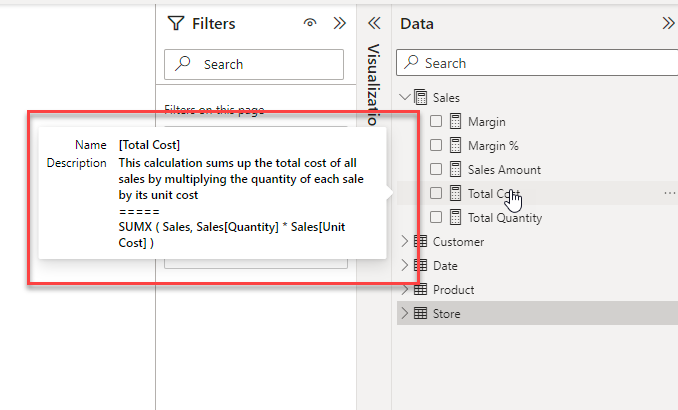
After running the script, you get a much more informative tooltip
the expanded tooltip showing the new auto-populated description
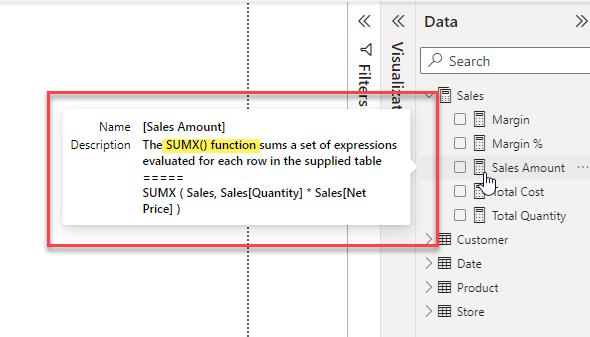
Interestingly the descriptions do seem to change a little bit from one run to the next and in spite of asking it not to use DAX function names in the description sometimes it still sneaks one in. The description below was particularly bad where it just described the SUMX function.
But the advantage of this technique is that you can re-run it for single measures if you like or you could manually edit the description field if the description needed a small improvement.
Update: 16 Feb 2023 – added note about API rate limiting
Update: 17 Feb 2023 – See part-2 here for short tutorials on how to run the script and an updated version which deals with the API rate limiting
This is a follow-up to my previous post on using a combination of DAX Studio and Tabular Editor to generate a series of measures based on the values in a given column. Which in turn was inspired by this excellent post by Phil Seamark.
While I was writing my previous post I sent a question to Daniel who is the author of Tabular Editor, asking if there was a way of getting the connection details when Tabular Editor was launched from the External Tools. The idea was that I should be able to do everything Phil did in his original script from the Tabular Editor Advanced Scripting feature.
Within an hour he actually came back with an even better approach which he had just added to Tabular Editor. As of Tabular Editor 2.12.0 the database object in Tabular Editor now has 3 new helper methods.
void ExecuteCommand(string tmsl)
IDataReader ExecuteReader(string dax)
DataTable ExecuteDax(string dax)
DataSet ExecuteDax(string dax)
object EvaluateDax(string dax)
Update 30 Aug 2020 There was an issue with certain queries and the ExecuteDax method. This has now been fixed and Daniel has extended this method to return a DataSet (which can contain multiple DataTables) and he has also added the EvaluateDax method which can evaluate simple DAX expressions.
Also these methods are also exposed as static methods. What this means is that you can just call ExecuteReader(query) instead of Model.Database.ExecuteReader(query)
These let you run DAX or TSML scripts directly against a connected data model. The advantage of these methods is that you don’t need to do any searching for port numbers or loading additional libraries and they make use of the existing authenticated connection, so there is no need to re-authenticate to the data model.
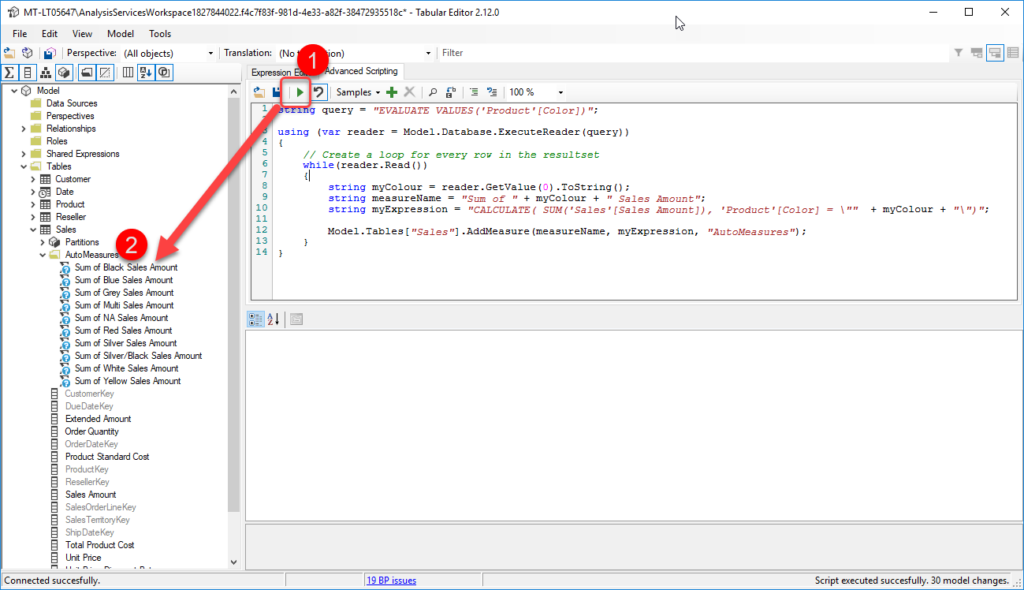
So with a simple 14 line script and no additional tools or downloads you can generate a set of data driven measures for your model. Simply click run (1) and your new measures appear in your model (2) and once you save them they will appear in Power BI Desktop.
Below is the text version of the advanced script if you want to modify this to work in your environment. This script is just a tweaked copy of the main loop in the original one Phil posted with a few small syntax changes as the Advanced Scripting appears to use a slightly older version of the c# compiler which does not have some of the newer features like interpolated strings.
string query = "EVALUATE VALUES('Product'[Color])";

using (var reader = Model.Database.ExecuteReader(query))
{
    // Create a loop for every row in the resultset
    while(reader.Read())
    {
        string myColour = reader.GetValue(0).ToString();
        string measureName = "Sum of " + myColour + " Sales Amount";
        string myExpression = "CALCULATE( SUM('Sales'[Sales Amount]), 'Product'[Color] = \""  + myColour + "\")";

        Model.Tables["Sales"].AddMeasure(measureName, myExpression, "AutoMeasures");
    }
}
If you are interested in more information on what can be done with the Advanced Scripting feature you can check out the documentation and the useful script snippets page. While you are there make sure to have a look at the Custom Actions as these are a great way to trigger generic scripts that you use on a regular basis.
Recent Comments