I had a colleague approach me at work with an interesting problem. He had a Power BI report using the Gantt chart custom visual however when he used a date slicer to select a date range it was only showing events which started on that date range and he wanted to see any events that were in progress for that date range.
I figured out a way to get this working and I thought it might be helpful to not just show the solution, but also to walk through the process I used to develop it. Let’s start by looking at an example of the issue he was dealing with.
Given the following data, what he wanted was to filter the data for dates between Mar-20 to Apr-10 so that the Gantt chart would show the section in Yellow below:
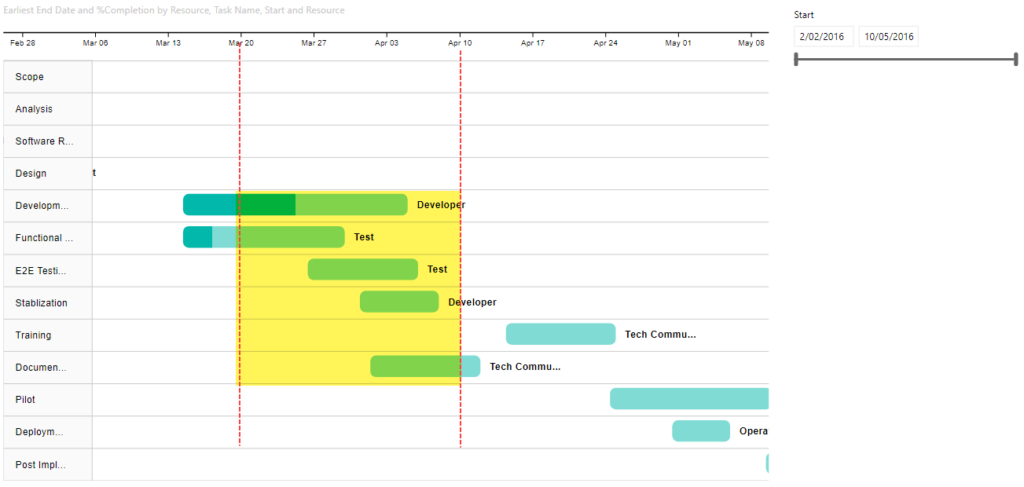
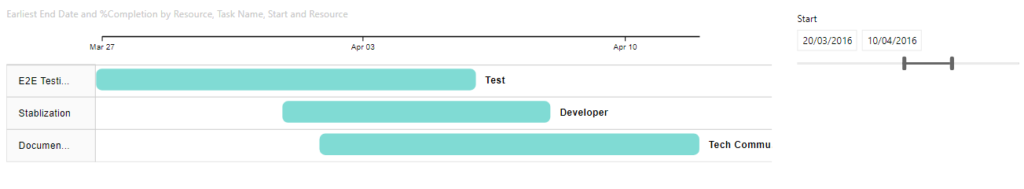
But he was getting output like the following, where it was only showing the bottom 3 tasks from the image above with a start date between Mar-20 and Apr-10. It was not showing tasks which were already in progress like the first two (Division… and Functional…).
To figure out what options we had to change this default behaviour I turned on the Performance Profiler in Power BI Desktop (I could also have used the All Queries trace in DAX Studio). This captured the following query for the Gantt visual:
// DAX Query
DEFINE VAR __DS0FilterTable =
  FILTER(
    KEEPFILTERS(VALUES('Table1'[Start Date])),
    AND('Table1'[Star Date] >= DATE(2016, 3, 20), 'Table1'[Start Date] < DATE(2016, 4, 11))
  )

EVALUATE
  TOPN(
    1002,
    SUMMARIZECOLUMNS(
      'Table1'[Task Name],
      'Table1'[Task ID],
      'Table1'[Start Date],
      'Table1'[Resource],
      __DS0FilterTable,
      "MinEnd_Date", CALCULATE(MIN('Table1'[End Date]))
    ),
    'Table1'[Task ID],
    1,
    'Table1'[Task Name],
    1,
    'Table1'[Start],
    1,
    'Table1'[Resource],
    1
  )

ORDER BY
  'Table1'[Task ID], 'Table1'[Task Name], 'Table1'[Start], 'Table1'[Resource]
There are two important parts to notice from the above query.
First is that the filter is currently explicitly filtering for start dates based on the values selected in the slicer. Obviously this is going to cause an issue as events that are already in-progress will have a start date before the earliest date in the slicer.
To fix this we need to create a separate date table that does not have a relationship to our main fact table. In the demo file I simply created a calculated table using Date Slicer = CALENDARAUTO() but you can use whatever method you like to create this table.
If we replace the 'Table1'[Start Date] field used in the slicer that “fixes” our issue of start dates earlier than those in the slicer being filtered out, but now our slicer is not filtering the data at all, but all is not lost, we will fix that next.
The second interesting thing that I noticed from the captured query is that [Start Date] is being used as a grouping column in the SUMMARIZECOLUMNS() function, but [End Date] is getting the earliest end using CALCULATE(MIN('Table1'[End Date])). What is happening is that the Gantt chart is creating an implied measure when we pass in the [End Date] column. So instead of letting the Gantt chart create an implied measure we can create our own measure and use that instead.
Below is the measure I developed
Gantt End Date =
VAR _maxDate =
    MAX ( 'Date Slicer'[Date] )
VAR _minDate =
    MIN ( 'Date Slicer'[Date] )
VAR _tasks = VALUES(Table1[Task ID])
RETURN
    MAXX (
        CALCULATETABLE (
            SUMMARIZE( Table1, Table1[Start Date], Table1[End Date] ),
            Table1[Start Date] <= _maxDate,
            Table1[End Date] >= _minDate,
            _tasks
        ),
        Table1[End Date]
    )
This gives us the following
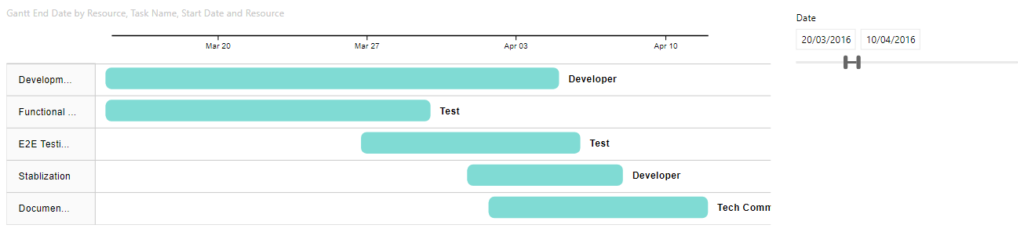
If you look at the output of this measure in a table all it does is the following:
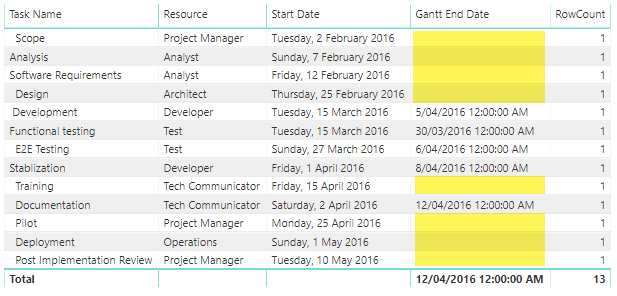
Note that I’ve force the display of all rows by including a simple row count measure. This lets us see that the [Gantt End Date] only returns values where the End date is after the start of the selected date range and the start is before the end of the selected date range, otherwise it returns a blank and SUMMARIZECOLUMNS does not return rows where all the measures return blank.
If you want to look at the Power BI file I used in the screenshots for this post you can download it from here
Recent Comments