Darren Gosbell

Month: August 2020

The best way to generate data driven Measures in Power BI using Tabular Editor

This is a follow-up to my previous post on using a combination of DAX Studio and Tabular Editor to generate a series of measures based on the values in a given column. Which in turn was inspired by this excellent post by Phil Seamark.

While I was writing my previous post I sent a question to Daniel who is the author of Tabular Editor, asking if there was a way of getting the connection details when Tabular Editor was launched from the External Tools. The idea was that I should be able to do everything Phil did in his original script from the Tabular Editor Advanced Scripting feature.

Within an hour he actually came back with an even better approach which he had just added to Tabular Editor. As of Tabular Editor 2.12.0 the database object in Tabular Editor now has 3 new helper methods.

  • void ExecuteCommand(string tmsl)
  • IDataReader ExecuteReader(string dax)
  • DataTable ExecuteDax(string dax)
  • DataSet ExecuteDax(string dax)
  • object EvaluateDax(string dax)

Update 30 Aug 2020 There was an issue with certain queries and the ExecuteDax method. This has now been fixed and Daniel has extended this method to return a DataSet (which can contain multiple DataTables) and he has also added the EvaluateDax method which can evaluate simple DAX expressions.

Also these methods are also exposed as static methods. What this means is that you can just call ExecuteReader(query) instead of Model.Database.ExecuteReader(query)

These let you run DAX or TSML scripts directly against a connected data model. The advantage of these methods is that you don’t need to do any searching for port numbers or loading additional libraries and they make use of the existing authenticated connection, so there is no need to re-authenticate to the data model.

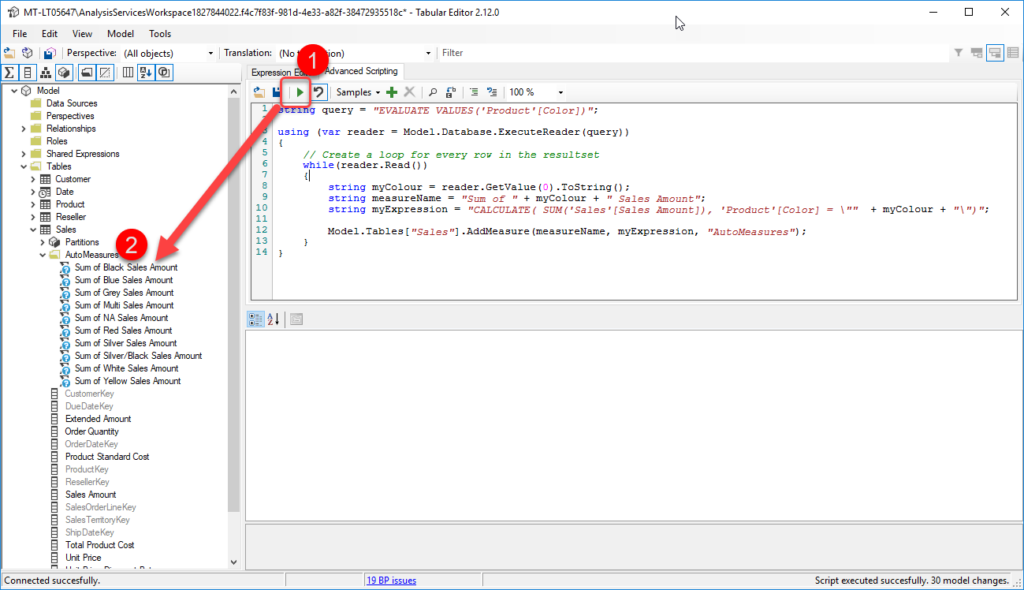
So with a simple 14 line script and no additional tools or downloads you can generate a set of data driven measures for your model. Simply click run (1) and your new measures appear in your model (2) and once you save them they will appear in Power BI Desktop.

Below is the text version of the advanced script if you want to modify this to work in your environment. This script is just a tweaked copy of the main loop in the original one Phil posted with a few small syntax changes as the Advanced Scripting appears to use a slightly older version of the c# compiler which does not have some of the newer features like interpolated strings.

string query = "EVALUATE VALUES('Product'[Color])";

using (var reader = Model.Database.ExecuteReader(query))
{
    // Create a loop for every row in the resultset
    while(reader.Read())
    {
        string myColour = reader.GetValue(0).ToString();
        string measureName = "Sum of " + myColour + " Sales Amount";
        string myExpression = "CALCULATE( SUM('Sales'[Sales Amount]), 'Product'[Color] = \""  + myColour + "\")";
                            
        Model.Tables["Sales"].AddMeasure(measureName, myExpression, "AutoMeasures");
    }
}

If you are interested in more information on what can be done with the Advanced Scripting feature you can check out the documentation and the useful script snippets page. While you are there make sure to have a look at the Custom Actions as these are a great way to trigger generic scripts that you use on a regular basis.

There is also a public github scripts repository with example scripts which you can download and use.

DAX Studio and Tabular Editor – better together

I love love the way Phil Seamark likes to push the art of the possible with the Microsoft BI platform. And I really liked his recent article on using VS Code to query a Power BI file and generate measures. But as I was reading that blog post I could not help but think that it was going to be outside of the comfort zone of a lot of Power BI users.

I know a lot of BI developers that have strong skills in DAX, Power Query and SQL, but don’t often use C# and many of them don’t use VS Code and have not heard of nuget. So this made me wonder if there was a another way of doing the same thing with the tools that many BI developers already use like DAX Studio and Tabular Editor

I actually figured out a couple of approaches to achieving the same result as Phil. The first one uses the following 2 pieces of information.

  1. Tabular Editor has a brilliant feature called Advanced Scripting which lets you run little pieces of C# code and is an excellent way of automating changes in your models. And in addition to being able to use the standard properties and methods Daniel has build a series of helpful “helper” methods like AddMeasure which has parameters for <Name>, <Expression> and <Folder>.
  2. As I showed in my previous post where I generated part of a DAX query using another DAX query. It is possible with some careful string manipulation to use DAX to generate other code such as the C# using in the Tabular Editor Advance Scripting feature.

If we combine the two pieces of information above we end up with the following query which generates a Tabular Editor AddMeasure() call for each value in Product[Color].

EVALUATE 
ADDCOLUMNS(
VALUES('Product'[Color])
,"ScriptExpression"
,var _color = 'Product'[Color] 
var _name = "Sum of " & _color & " Sales Amount"
var _expression = "CALCULATE(SUM('Sales'[Sales Amount]) ,'Product'[Color] = \""" & _color & "\"")"                     
return "Model.Tables[""Sales""].AddMeasure( """ & _name & """, """ & _expression & """, ""AutoMeasures"");"
)

When you open DAX Studio from the External Tools menu and run this query you get output that looks like the following and you can selected the “ScriptExpression” column and copy that.

Then you open Tabular Editor from the External Tools menu. Click on the Advanced Scripting tab and paste in the output from the “ScriptExpression” column. Note this may include the “ScriptExpression” column header at the top which you will need to delete.

(note to self, I should add a “copy without headers” option to DAX Studio, there is an option for this, but it would be nice to add it to the right-click menu on the results)

Then when you click “run” (1) on the advance script, you will see a folder with all your new measures appear (2). You can then check that the expression has been entered correctly and click save (3) to make these appear back in Power BI Desktop.

Stay tuned for the next post in this series where I will show another technique for doing this.

The easy way to Generate a DAX query for all measures

I had an interesting request from a Data Scientist in our team recently. He’d been extracting some data from one of our tabular models, however he was having some trouble getting his predictive model working reliably.

We already had a query in the form similar to the following where we had a couple of group by columns, one or two filters and a handful of measures:

EVALUATE
SUMMARIZECOLUMNS(
   'Table1'[Column1],
   'Table2'[Column2],
   FILTER(ALL('Table1'[Column3]), 'Table1'[Column3] = "Value",
   "Measure1", [Measure1],
   "Measure2", [Measure2]
) 

Up until this point we had been manually adding measures that we though may influence the behaviour we were trying to predict, but this was a slow, trial and error based process. So the Data Scientist rang me and said “You know what? Why don’t you just give me an extract with all the measures?”. “You do realise we have over 1,000 measures” I said, “because we have lots of time intelligence variations like Current Month, Previous Month, Month over Month variance, etc.” and . “That’s fine he replied, I can always ignore any that I don’t want or that are not significant – you can just do something like a SELECT * right?”.

So if you’ve ever written your own DAX queries you would know that you can do a query like the following to get all the columns in a single table

EVALUATE 'Table'

But that will not get you any measures, you have to list out the measures manually one, by one. At this point I knew that I really did not want to spend hours to hand type a query with over 1,000 measures so I starting thinking what options I might have for generating this query.

I knew I could probably build some sort of foreach loop in Powershell using AMO/TOM. Or I could maybe use the Advanced Scripting in Tabular Editor. But I also knew that I could easily get a list of all the visible measures by querying the $SYSTEM.TMSCHEMA_MEASURES or $SYSTEM.MDSCHEMA_MEASURES DMV’s using DAX Studio

After a bit of experimenting I ended up with the following expression which builds a list of all the visible measures in the model in the "Name", Expression format that is needed for SUMMARIZECOLUMNS

SELECT	'"' + [Name] + '", ' as [Caption], '[' +  [Name] + '],' as [Name]
FROM $SYSTEM.TMSCHEMA_MEASURES
WHERE NOT [IsHidden]
ORDER BY [Name]

Then I was simply able to paste in the output from this query after the filters in our existing query and run it – Job done.

DAX Studio 2.12.1 Released

There are just a few minor updates to DAX Studio in this release

New Features

  • Pasting a connection string into the server name of the Connection dialog will parse out the Data Source and Initial Catalog settings

Fixes

  • #391 – issues when copying Power BI Performance data and pasting into Excel
  • #393 – application crashed if you attempted to open the Initial Catalog list before specifying a server
  • #394 – output to text file was not working for multiple results sets
  • #397 – “All Queries” trace was not working against PowerPivot connections