I’ve just released v3.3 of DAX Studio. The list of updates and fixes is available here v3.3.0 Release | DAX Studio
Category: DAX Studio (Page 1 of 2)
I am happy to announce that v3.1.0 of DAX Studio has just been released. There are a number of new features in this release including a brand new command line which will allow for the automation of common tasks. Be sure to read through the details of all the new and updated features here: v3.1.0 Release | DAX Studio
Today I am pleased to announce that the next update to DAX Studio is now available. It is a minor point release that includes one or two small updates and a number of fixes including what is hopefully a definitive fix to the “xmlReader in use” errors some of you have been seeing in 3.0.6
Check out the detailed release notes here v3.0.7 Release | DAX Studio
I am pleased to announce that v3.0.6 of DAX Studio has just been released. You can download this version from https://daxstudio.org and for more details on what’s new in blog post here v3.0.6 Release | DAX Studio
Some of you may have already seen the video from SQLBI showing the new timeline feature in Server Timings – if not, you should definitely watch this as it has some great information on this new feature and how to use it.
I’ve just pushed out an update to DAX Studio with a number of fixes and a few small updates. You can download it now from https://daxstudio.org
Updates
- Added query information button to traces
(This captures the actual query text and any parameter values plus the ActivityID) - Updated Query History icons
- #949 Exposed Theme/Mode setting in Options
- Added MPARAMETER keyword to syntax highlighting
Fixes
- Fixed #891 Error exporting to static Excel file
- Fixed #889 crash when dragging trace windows
- Fixed #886 incorrect link to tutorial in Getting Started dialog
- Fixed #894 Define and Expand sometimes producing incorrect output
- Fixed #924 username blank in All Queries trace
- Fixed #930 increased default code completion window width
- Fixed #931 automatically select all text in find/replace dialog
- Fixed #906 improved waterfall layout in Server Timings
- Fixed setting focus in the editor when changing tabs
- Fixed file icon registration
- Improved error handling around shutdown operations
- Added extra hotkey validation rules
- Fixed #916 added retry logic to all clipboard operations
- Improved Power BI filename detection for non-English cultures
- Removed unused dependencies and reduced installer/portable file size
I know it’s been a while since I’ve released an update to DAX Studio. But I’m happy to announce that version 3.0 is now available with a major update to the User Interface including the option for a Dark theme. You can download it from https://daxstudio.org (which has also had a major update and can be viewed in Dark mode) and you can read about what’s new in this release here: v3 Release | DAX Studio
DAX Studio 2.17.2 has just been released and the following is a run down of the new features and fixes that you will find in this release.
Apologies to anyone who attempted to download the 2.17.0 release – there was an update to the code signing tool and it failed to correctly sign the installer. The automated build has now been fixed so that it correctly signs the installer again.
New Features
Added Parameter support to Query Builder filters
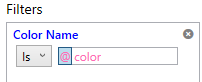
The Query Builder now supports parameters. Typing an @ as the first character in a query builder filter value will switch the value into parameter mode and the following text will be treated as the parameter name. (typing @ a second time or clicking on the purple @ button will toggle the parameter back to the standard value mode)
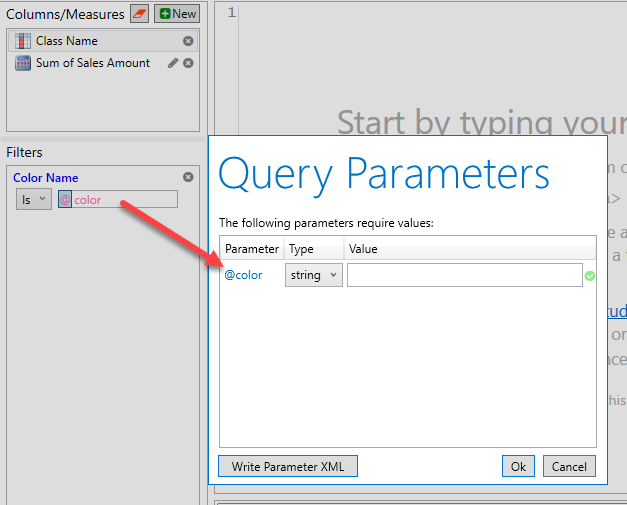
When you run the query builder where a filter has a parameter you will be prompted for the parameter value just as if you had typed out a query that included a parameter reference. This allows you to build a query with parameters that can be pasted into a paginated report or any other tool that supports DAX parameters.
Removing <pii> tags from xmSQL in Server Timings to improve readability
Power BI and AzureAS have added <pii> tags around some of the text in the query events that DAX Studio captures as part of the Server Timings. These tags allow Microsoft to strip out information that could potentially be personally identifiable when writing them to centralized logs. But because DAX Studio does not send any of this information off your machine and because this information also includes important contextual information for troubleshooting and performance tuning we are just removing these tags to reduce the noise and improve readability.
Fixing accuracy of Server Timings for queries with Batch events
Prior to this update Storage Engine batch events timings were not being added to the SE duration figures. For a lot of models this difference is insignificant, but for large queries against large models this can result in an incorrect inflation of the FE duration. Keep an eye on the posts from Marco and Alberto at sqlbi.com as they are working on an in-depth video to explain this improvement to the Server Timings.
Query Builder queries are now captured in the query history
Prior to this update the Query History pane was only capturing the text of queries that had been typed into the query editor. Now the Query History pane captures any query that was executed regardless if it was from the edit window or from the Query Builder.
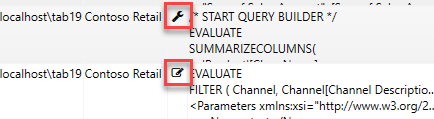
There is now an icon next to each query history row indicating where it was captured from and if you double click on a query that was originally run in the Query Builder it will be restored back into the Query Builder window
The /f parameter can now open vpax files
Now when you run DAX Studio from the command prompt the /f parameter will open either .dax or .vpax files.
Added extra information to the error message when the XMLA endpoint is not correctly enabled
If the Power BI XMLA endpoint is not properly enabled the Microsoft ADOMD provider returns a very generic error message making it hard to know what has gone wrong. DAX Studio now adds some extra text after the Microsoft error if you are attempting to connect to an XMLA endpoint and hit this generic WebException error to suggest you check the XMLA endpoint settings in your tenant.
Improved caching of measure expressions
Prior to this update features that required access to the text of the multiple measure expression such as the “Define All Measures” feature would request the expression text one at a time, now all of the measure expressions are retrieved in a single request.
Fixes
- Fixed #703 preventing a crash when entering a proxy password
- Fixed #715 added DOUBLE data type to intellisense and syntax highlighting
- Fixed #740 export to Excel failed on some machines
- Fixed #755 saving parameters to XML was not correctly encoding special characters
- Fixed #750 would crash on startup if the WMI information on the machine was corrupt
- Fixed download link in Help – About screen
DAX Studio v2.16.2 has just been released and is available at daxstudio.org. It includes the following fixes and improvements. The first one being particularly important:
Traces fail to start with a timeout error
Fixed issue #664 – A small refactoring of the trace engine for some future work has accidentally resulted in the engine not being able to detect if a trace has been started or not, resulting in timeout errors. This appears to affect most scenarios apart from one or two edge cases. Unfortunately it was one of those edge cases that was used when testing that the previous code change had not broken anything. The 2.16.2 code base has been tested against all the different engine types PowerPivot, Power BI Desktop, Power BI Desktop as an External Tool, a local SSAS Instance, a remote SSAS Instance, Power BI Premium XMLA Endpoints and Azure Analysis Services
Showing View Metrics Last Refreshed and Analysis Date in the local timezone
Fixed issue #663 – Previously the Last Data Refresh and Date of Analysis were both displayed in UTC in the Summary tab of the View Metrics pane. Internally the dates are still stored in the vpax file in UTC so that that if you send the vpax file to someone in a different timezone the times will n
When saving a file with the Query Builder open custom measure names were not saved
Fixed issue #659 – if you save a file with the query builder open which has custom measures that were created within the query builder then the name of those custom measures was not saving properly prior to this fix.
Debug commas not handling lines with indented comments correctly
Fixed issue #663 – the new debug commas preview feature was not correctly positioning the commas if one of the lines of the query had an indented comment. This issue and a few other ones around different comment placements have been fixed.
View Metrics – Last Refreshed date was incorrectly adjusting from UTC time
Fixed issue #670 – The Last Refreshed Datetime in the View Metrics summary page was incorrectly getting the timezone offset applied twice when calculating the UTC time. This resulted in the time being moved too far forward if your local timezone is behind UTC or too far back if your local timezone is ahead of UTC.
This update to DAX Studio includes all the new features introduced in 2.16.0 but includes the following bug fixes:
- #657 Unable to open a new query tab either with a new connection or with a copied connection
- #658 passing the database name on the command line
- #647 hidden objects not hidden correctly when show hidden objects option was turned off (this was partially fixed in 2.16.0 but should work in all scenarios now)
The latest release of DAX Studio is now available with the following new features and fixes.
New Features
Added Sponsor page to daxstudio.org
We are now able to accept sponsorship via Github Sponsors. If you would like to make a financial donation to support the continued development of DAX Studio you can now sponsor the project at https://github.com/sponsors/DaxStudio
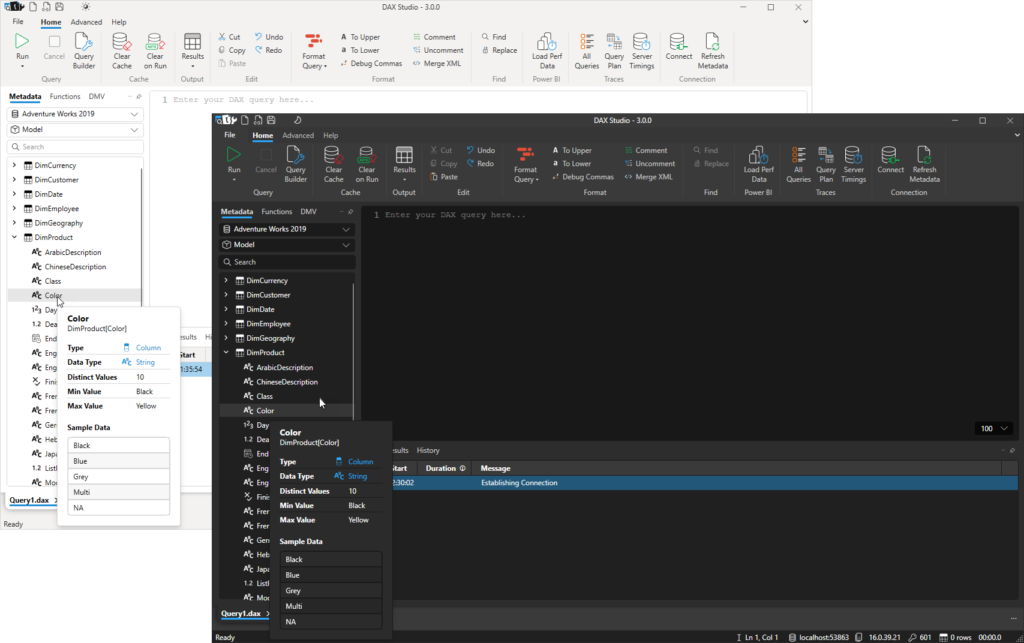
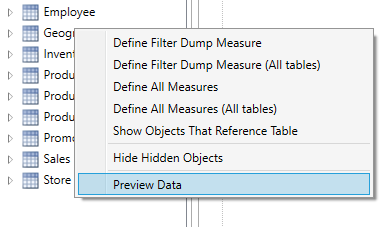
Added preview Data for tables and columns
A new right-click menu has been added to tables and columns which will display a preview of the first 500 rows of data.
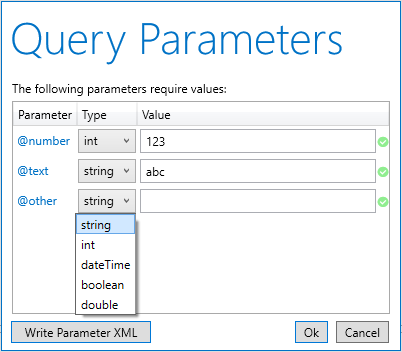
Extended Parameter Support to data types other than text
Previously parameters were always passed through as text based parameters. As of v2.16 you can now specify the data type for your parameters. This support is available both in the parameter dialog and in the XMLA parameter blocks.
When you specify @parameters in your DAX queries they will still default to the string data type, but there is a new dropdown which allows you to change this to one of the other supported datatypes (this list matches the parameter data types supported by Report Builder and Power BI Report Builder)
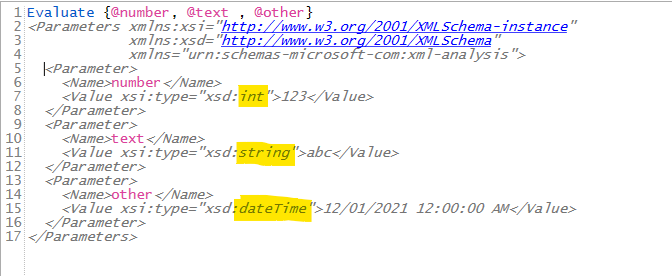
And if you choose the Write Parameter XML button or if you capture the query parameters using the All Queries trace those data types will also be reflected in the XML parameter block.
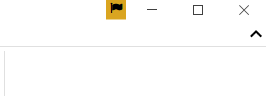
Added new version notification in title bar
When a new update is available there will be an update flag in the top right of the application and clicking on that flag will take you straight to the download page for that version.
Updated xmSQL cleanup to also fix table names
In the previous release of the xmSQL update feature we were cleaning up column names to match the display names, in this release this functionality was extended to also clean up table names.
Supporting all of the /f /s /d command line parameters at the same time
DAX Studio has always had support for the following command line parameters
/f <filename> – to open a .dax file
/s <server> /d <database> – to connect to a server and database
But prior to this release you could only use /f on it’s own. As of this release you can use all 3 of these parameters together.
Query Builder Enhancements
The Query Builder has a number of new features in this release which are outlined below.
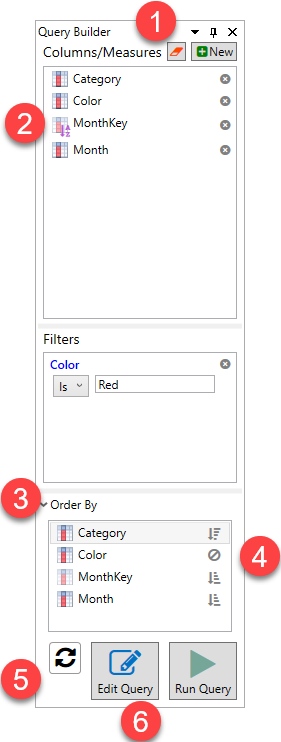
- There is a new Clear button at the top of the Query Builder which gives you a convenient single click to clear everything from the Query Builder.
- Now when you drag a column which has a Sort-by column the sort by column is added to the output list (this is required to support the next item)
- There is a new Order By pane, this is collapsed and all columns are sorted in ascending order by default.
- But you can expand this section and click on the columns there to switch them between sorting Ascending, Descending or ignored.
- There is a new Auto-Generate button. When you click on this button the query generated by the query builder will appear in the edit window and will be updated in real time as you make changes to the Query Builder
- Clicking the Edit Query button will now update any previously generated query rather than adding a new version underneath.
Extending installer support for Windows ARM64
The installer used to do a platform check for x86 or x64, this has been extended to allow installing on ARM64 since that platform now has an x64 emulation layer.
Other Enhancements
- #620 Adding Ctrl+W to select current word
- #584 Extending Hover tooltip to work with Keywords
- Custom Key-Bindings moved out of preview
- #636 Show PBIX filename instead of database ID in the database dropdown when connected to Power BI Desktop
- #638 Adding encoding option when exporting to CSV
- updating ADOMD / AMO references to 19.22
Preview Features
Debug Commas
This command moves commas in formatted queries to the start of the line. This re-formats the selected text so that you can more easily comment out sections of code while debugging.
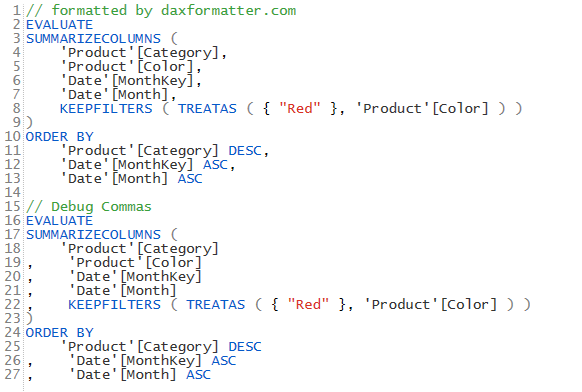
Note: this preview feature replaces the swap delimiters button in the ribbon.
Show XMLA Commands in All Queries trace
This option is useful for viewing commands sent by other tools like SSDT and Tabular Editor.
Fixes
- #578 Analyze in Excel not working with PBI XMLA or AzureAS
- #579 Server Timings Layout Tab not appearing
- Improved error message when no query text is specified
- #581 All Queries Trace against PowerPivot caused crash
- Fixed a crash when attempting to add a display folder to the Query Builder
- Fixed a crash when attempting to use the query builder against a model with an invalid calculation script
- #592 datatypes not syntax highlighted and not in code completion
- #613 DMV and Function drag/drop not working
- #647 Hiding hidden objects was not working correctly with items in display folders
- #643 fixing issue with code completion window “sticking”
Recent Comments