At the time of writing this post there is no built-in support for creating dynamic per recipient subscriptions for paginated reports if your report has any multi-value parameters. But there is a simple workaround that should enable you to set this up with minimal extra overhead.
Overview
The basic idea is to create a report just for your dynamic subscriptions that has a simple text parameter which you can then split based on some delimiter to pass to your “main” report.
The problem
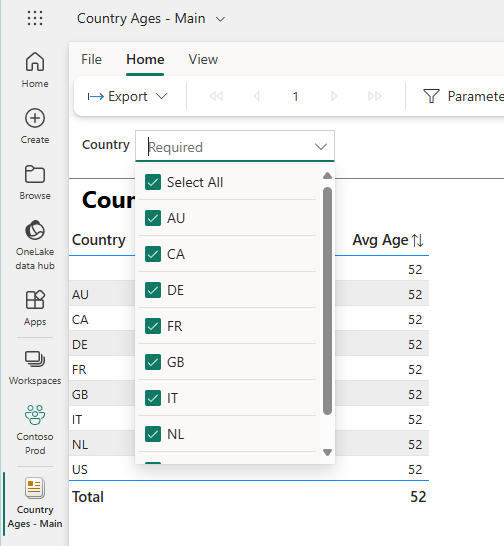
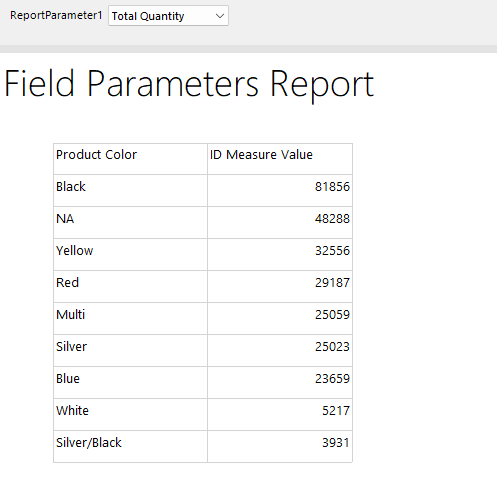
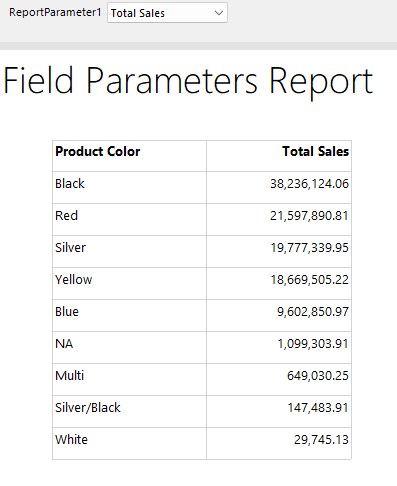
To test this, I created a simple report using some Contoso data which has a list of country codes and the average customer age in each country. The actual data is not important, but the fact that I have a required multi-value parameter means that when you try to create a dynamic subscription it will throw an error when the subscription runs. I’ll refer to this as the “main” report.
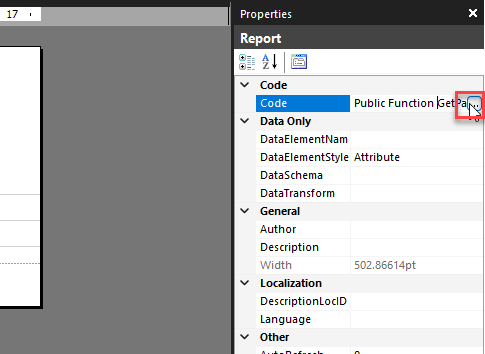
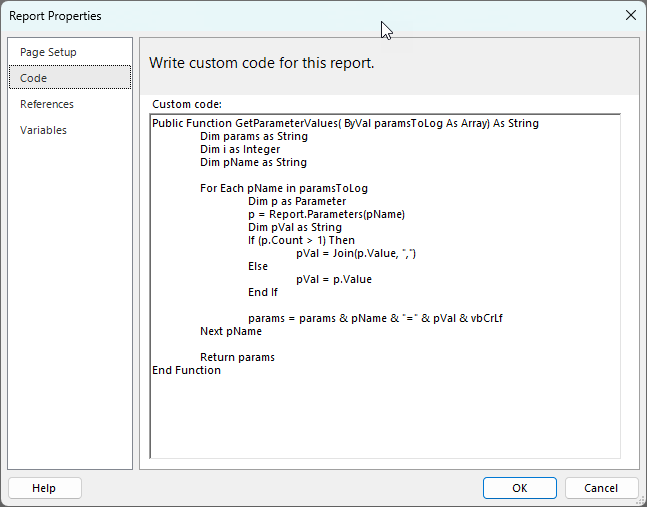
This is what the parameter for my “main” report looks like
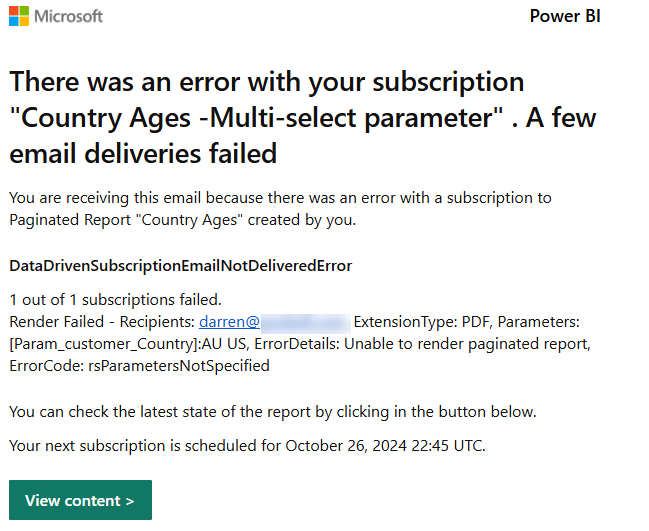
This is the sort of error that the subscription owner will see if you try to pass multiple values to the Country parameter:
The solution
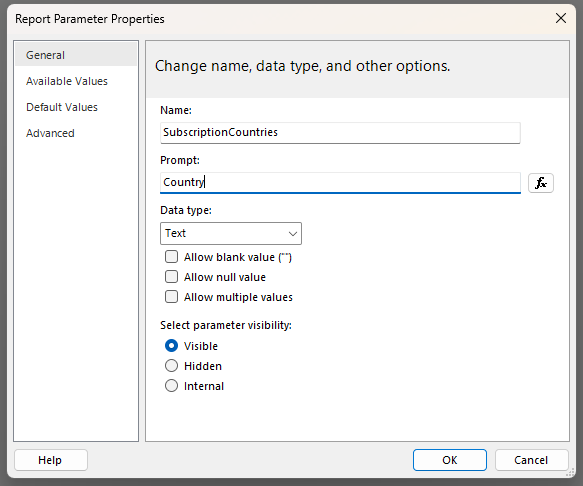
To work around this issue, I created a second report, which we will call the “subscription” report. I then created a local parameter which I called “SubscriptionCountries” so that I would know that this is the parameter in the “subscription” version of the report. You need to create one parameter in this report for each of the parameters in your “main” report.
Even though the Country parameter in the “main” report has the “Allow multiple values” option checked I did not select this in the “subscription” report and left it as a plain text parameter – this is the key to getting the subscription to work
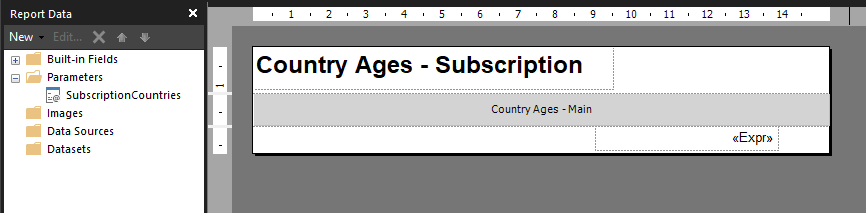
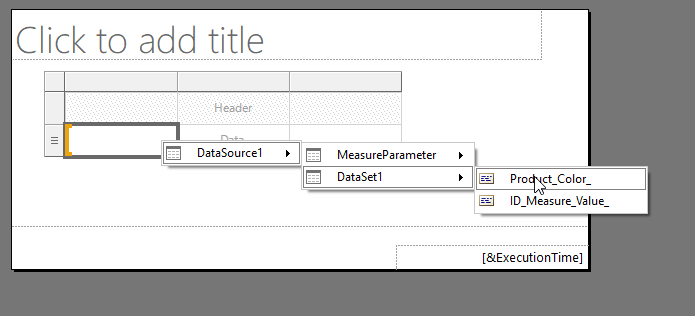
I then inserted a subreport and removed all the surrounding whitespace. I also made sure to configure the width of this report to be the same as the “main” version of the report. Then I configured the properties of this subreport to use the “main” version of the report.
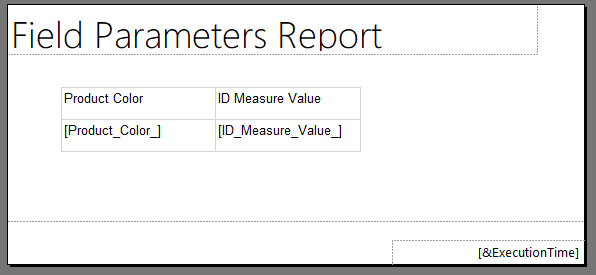
I also had to setup the header and footer in the “subscription” report since subreports only render the body area of the report.
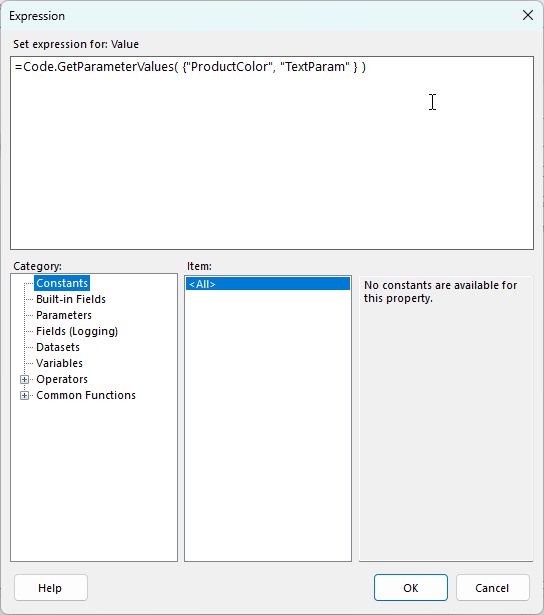
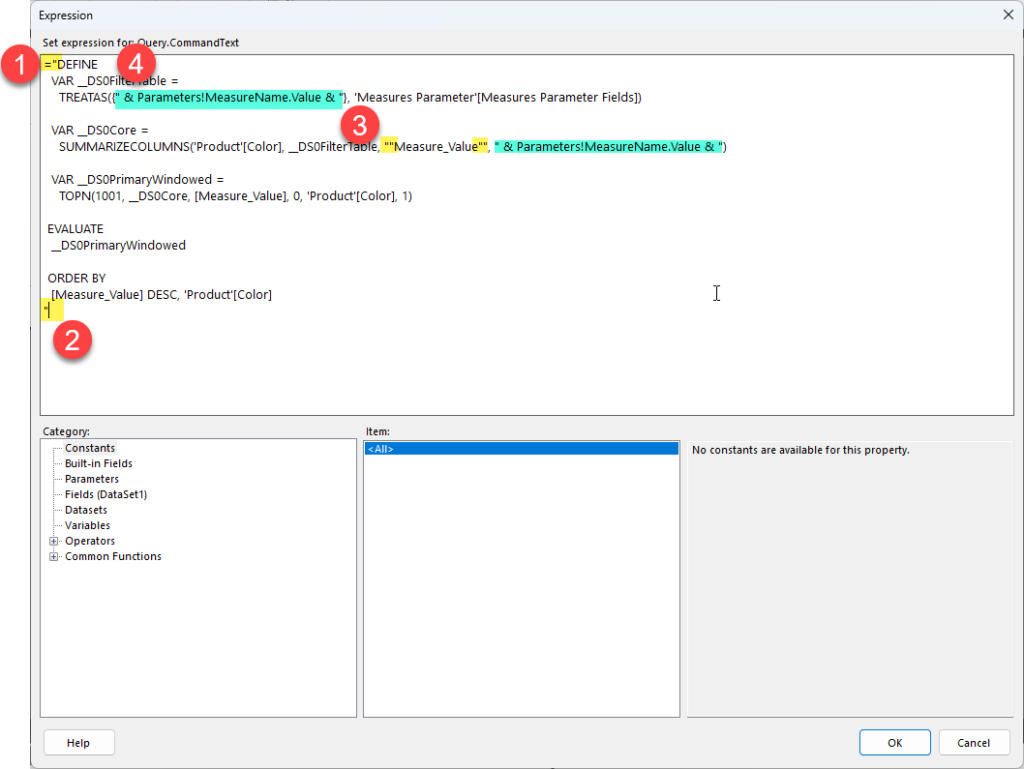
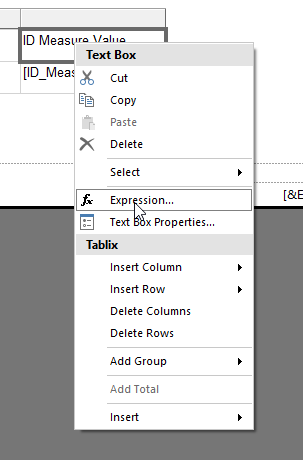
The next step was to configure the parameter properties for the subreport. For any parameters that are not multi-select you can just map these directly to the subscription version of the parameter. But for any multi-value parameters the trick is to set these using an expression.
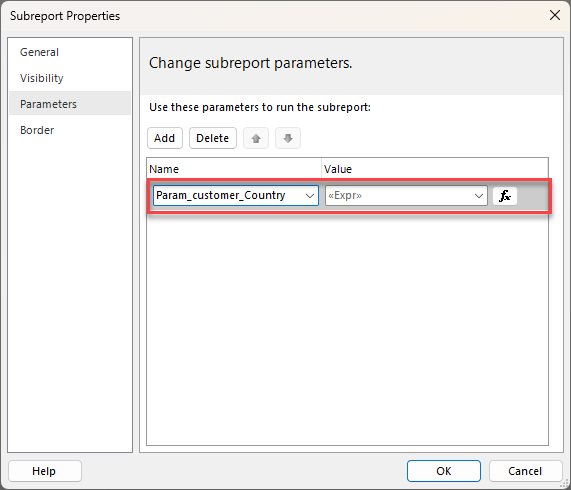
In my case I chose to pass the multiple values as a comma separated string, using the following expression, but if you wanted to use a different parameter like a semi-colon or pipe character you could do that.
=Split(Parameters!SubscriptionCountries.Value,",")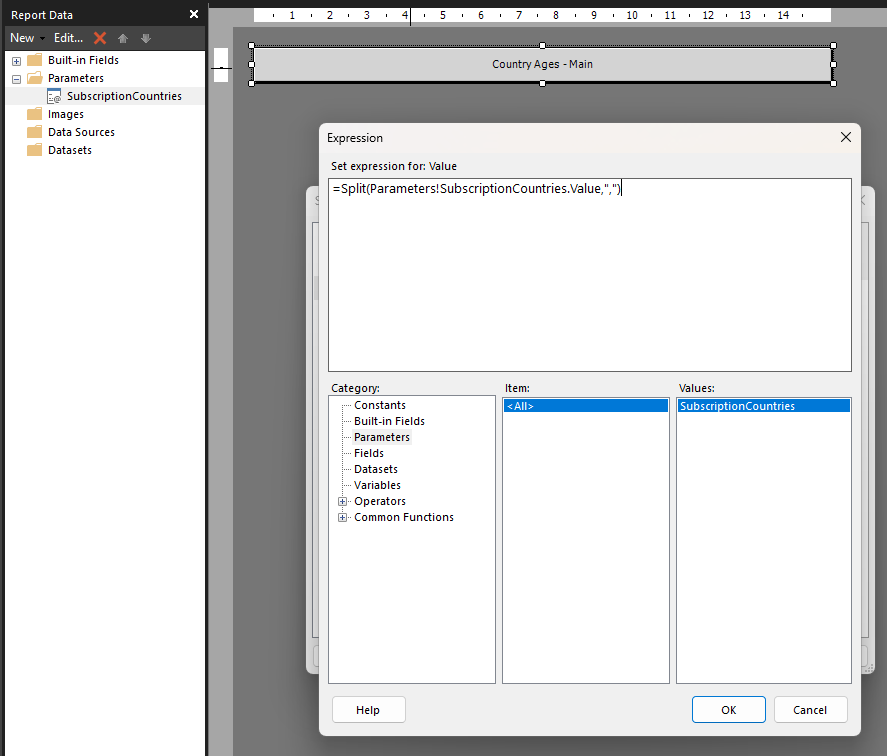
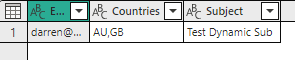
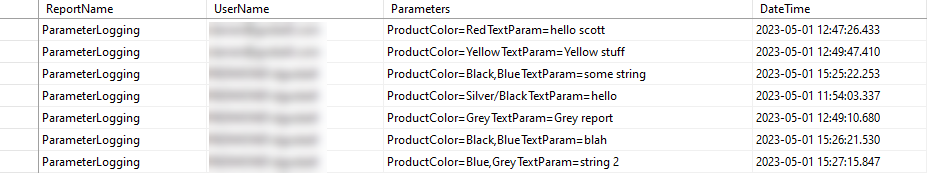
The rest is simple, I just created a semantic model that contained the multiple values as a comma separated string and then configured my dynamic per recipient subscription to use that value
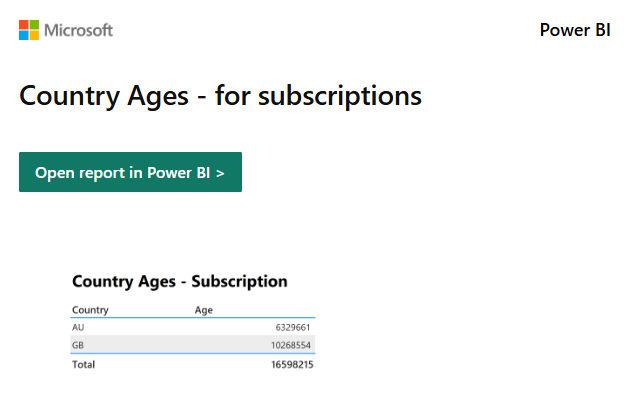
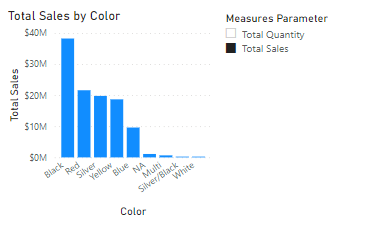
Then when the subscription ran, I received the following email in my inbox
Conclusion
While it would be nicer if dynamic subscriptions had native support for multi-valued parameters at least this technique should unblock you with minimal extra work.
To keep your workspace “cleaner” I would suggest putting these special subscription versions of the reports in their own folder in your workspace.
Recent Comments