Darren Gosbell

Author: Darren Gosbell (Page 4 of 5)

The easy way to Generate a DAX query for all measures

I had an interesting request from a Data Scientist in our team recently. He’d been extracting some data from one of our tabular models, however he was having some trouble getting his predictive model working reliably.

We already had a query in the form similar to the following where we had a couple of group by columns, one or two filters and a handful of measures:

EVALUATE
SUMMARIZECOLUMNS(
   'Table1'[Column1],
   'Table2'[Column2],
   FILTER(ALL('Table1'[Column3]), 'Table1'[Column3] = "Value",
   "Measure1", [Measure1],
   "Measure2", [Measure2]
) 

Up until this point we had been manually adding measures that we though may influence the behaviour we were trying to predict, but this was a slow, trial and error based process. So the Data Scientist rang me and said “You know what? Why don’t you just give me an extract with all the measures?”. “You do realise we have over 1,000 measures” I said, “because we have lots of time intelligence variations like Current Month, Previous Month, Month over Month variance, etc.” and . “That’s fine he replied, I can always ignore any that I don’t want or that are not significant – you can just do something like a SELECT * right?”.

So if you’ve ever written your own DAX queries you would know that you can do a query like the following to get all the columns in a single table

EVALUATE 'Table'

But that will not get you any measures, you have to list out the measures manually one, by one. At this point I knew that I really did not want to spend hours to hand type a query with over 1,000 measures so I starting thinking what options I might have for generating this query.

I knew I could probably build some sort of foreach loop in Powershell using AMO/TOM. Or I could maybe use the Advanced Scripting in Tabular Editor. But I also knew that I could easily get a list of all the visible measures by querying the $SYSTEM.TMSCHEMA_MEASURES or $SYSTEM.MDSCHEMA_MEASURES DMV’s using DAX Studio

After a bit of experimenting I ended up with the following expression which builds a list of all the visible measures in the model in the "Name", Expression format that is needed for SUMMARIZECOLUMNS

SELECT	'"' + [Name] + '", ' as [Caption], '[' +  [Name] + '],' as [Name]
FROM $SYSTEM.TMSCHEMA_MEASURES
WHERE NOT [IsHidden]
ORDER BY [Name]

Then I was simply able to paste in the output from this query after the filters in our existing query and run it – Job done.

DAX Studio 2.12.1 Released

There are just a few minor updates to DAX Studio in this release

New Features

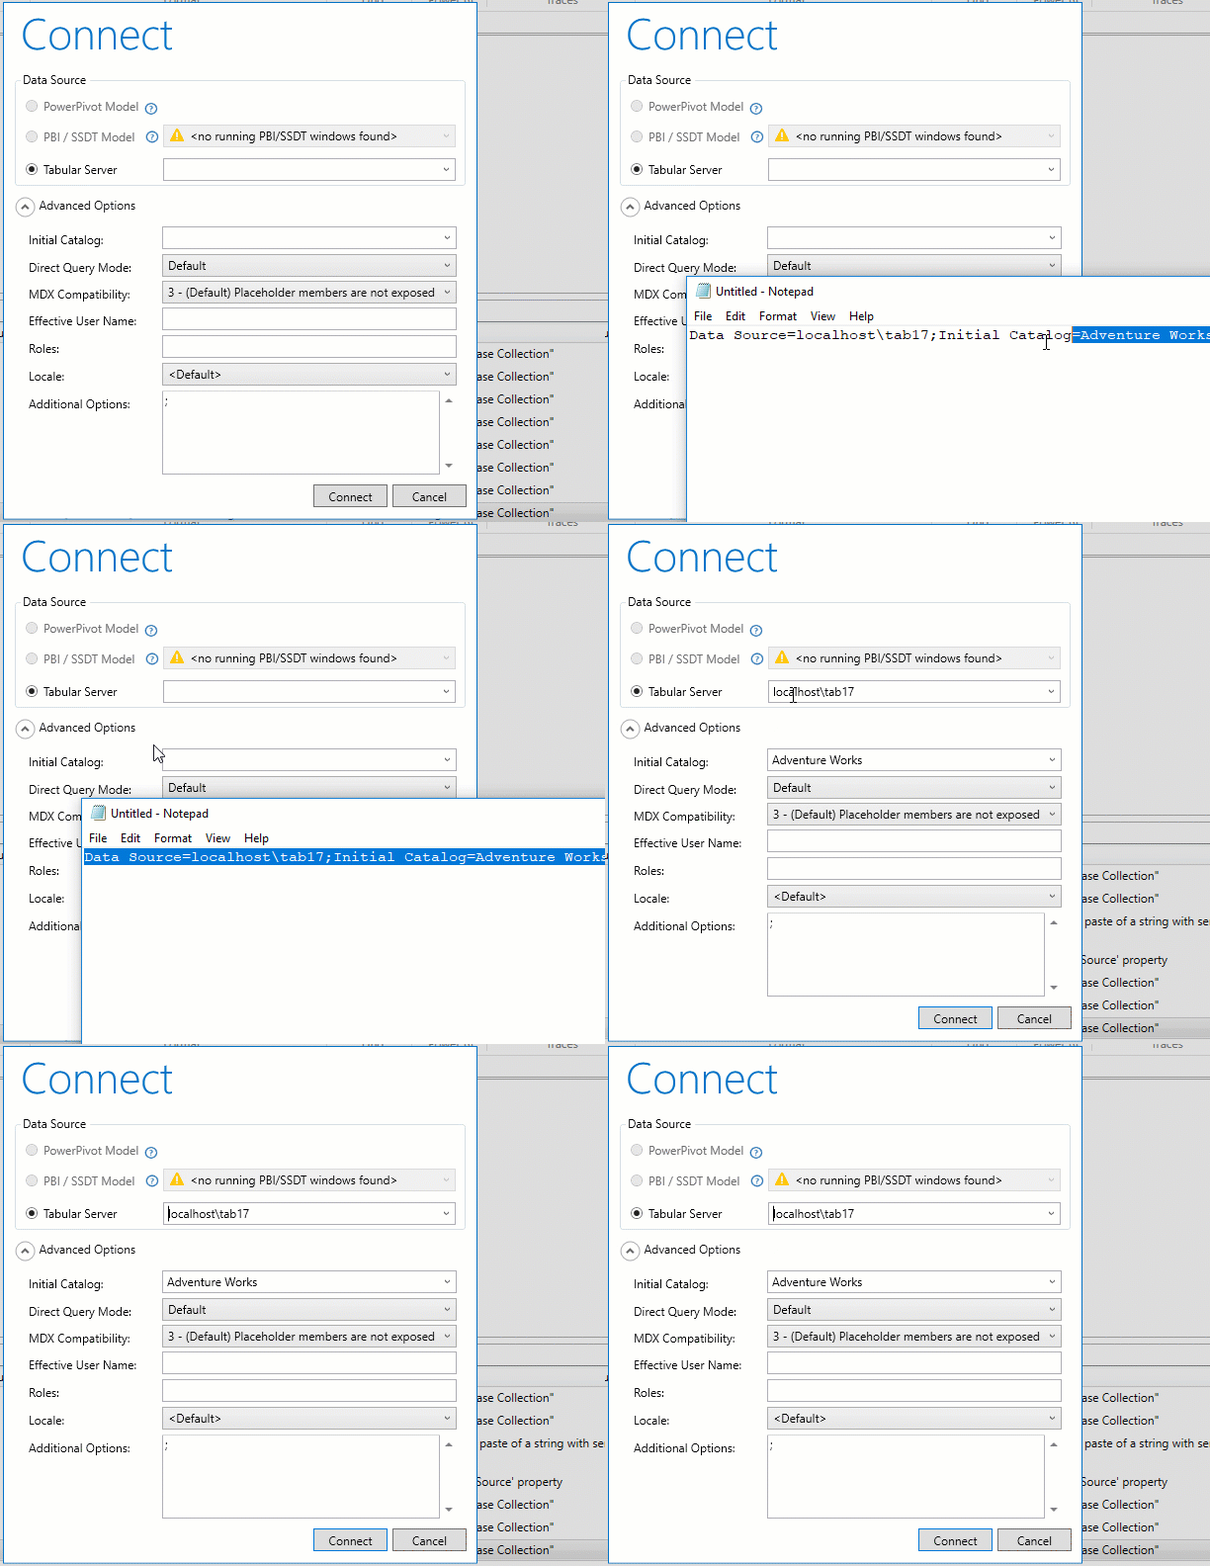
  • Pasting a connection string into the server name of the Connection dialog will parse out the Data Source and Initial Catalog settings

Fixes

  • #391 – issues when copying Power BI Performance data and pasting into Excel
  • #393 – application crashed if you attempted to open the Initial Catalog list before specifying a server
  • #394 – output to text file was not working for multiple results sets
  • #397 – “All Queries” trace was not working against PowerPivot connections

DAX Studio 2.12 release

DAX Studio 2.12 has just been released and I wanted to take some time to walk through some of the significant new features in this release.

The Installer is now signed with EV Certificate!

The fact that Installer now signed with an EV certificate might sound like technobabble but this should hopefully prevent all the issues and warnings people have been getting from from Windows SmartScreen when attempting to download and install DAX Studio.

A HUGE thank-you goes out to the guys at SQLBI.com. To acquire an EV certificate not only requires a financial outlay, but you also need to have a legal company entity with a physical office and financial records and things like that. Both of these things make it pretty much impossible for a free/open source tool to obtain an EV certificate on their own without assistance.

Note: Even though Windows may show SQLBI as the publisher this is due to the fact that they have funded the code signing certificate and it is a condition of the EV certificate that it has to bear the legal name of the entity that purchased it. DAX Studio is still an open source tool and all support requests still go through our github issue register.

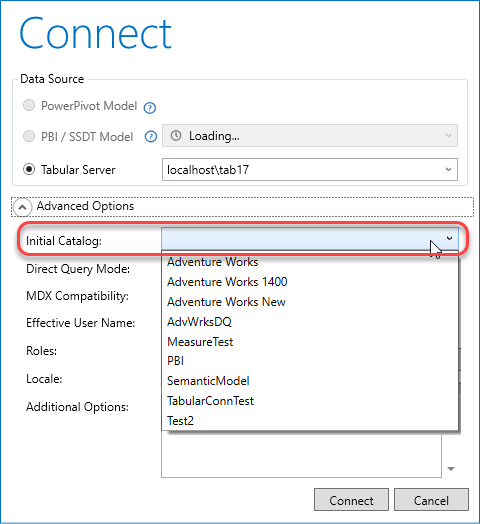
Initial Catalog option added to Connection Dialog

An Initial Catalog setting has been added to the Advanced Options in the connection dialog, if you have a very large model or slow connection (like AzureAS or VPN) then you can now choose the initial database you are connected to. This saves you having to wait for the metadata to load for the default database, then change to another database and wait for the second lot of metadata to refresh.

In future I also want to look at improving the ability for DAX Studio to automatically re-connect to dropped connections. But that will have to wait for a future release.

Format Query button updated

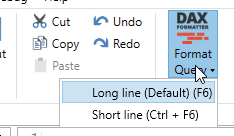
The Format Query button has been changed into a split-button so that you can choose the style of formatting by clicking on the bottom half of the button.

Clicking the top half of the button will still trigger the default formatting style (which can be changed in the Options menu)

Portable version

DAX Studio now has a portable download option. The portable version is just a zip file which you can unzip then run by clicking on DaxStudio.exe. This is helpful if you need to run DAX Studio on a machine where you may not have admin rights or where you do not want to run the installer.

The portable version has the following limitations:

  • The Excel addin is not included (as we need to write to the registry with admin rights to register the addin with Excel)
  • The Power BI Desktop External Tools feature will not work (as it requires admin rights to add the pbitools.json file under c:\program files\…)
  • The ability to double click on a .dax file to open DAX Studio will not work (this also requires making registry changes to the machine)

Otherwise the portable version is identical to the installed version. Apart from the above limitations the only difference is that settings, query history, autosave files and error logs are all redirected to local files and folders underneath the folder where daxstudio.exe is launched from

Other New Features

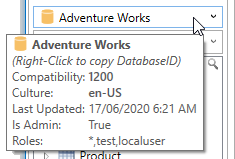
  • Added Roles and IsAdmin properties to Database tooltip that can be useful when testing security settings.

Fixes

  • #378 Power BI External Tools – installer not correctly updating path in daxstudio.pbitools.json file if a non-default install location is used
  • #377 exporting tables with no rows would throw an error
  • #376 autosave not recovering open files for all types of crashes
  • #374 improved tooltip sampling to prevent full column materialization
  • Fixed crash when attempting to export using invalid manual connection string
  • #381 re-connecting to a pbix file that has been closed and re-opened after launching from External Tools does not work

DAX Studio 2.11.2 Released

I’ve just pushed out a minor update for DAX Studio, it fixes a few issues I’ve received from crash reports as well as the following items:

Updates

  • Adds support for the “External Tools” ribbon in Power BI Desktop

Fixes

  • #373 Fixes “Define Measure” when connected to a SSAS instance without admin rights
  • #372 Duplicate MyMeasures created when adding more than 1 custom measure in the Query Builder
  • #367 Measure information duplicated in VPAX files
  • Fixed crash when highlighting
  • Fixed crash when closing last tab and connection had been lost

DAX Studio 2.11.1 Release

I just published a point release for DAX Studio that fixes the following bugs. You can get it from https://daxstudio.org

Fixes

  • Filters on datetime columns where we cannot parse the date value now report the error rather than crashing when using the “Edit Query” button
  • #343 Fixed spelling of KEEPFILTERS for IS NOT filters in the new Query Builder
  • #345 Comma placement changed to match the style used by DaxFormatter
  • #346 / #347 DaxFormatter now works in the Expression Editor
  • #351 error while exporting tables to SQL Server
  • #352 hierarchies in display folders not expanding
  • #357 leading/trailing comments missing when doing “define measure”

Power BI Report Server – fixing Pending subscriptions

Last week I came across an issue where a number of our paginated report subscriptions at work failed to go out. When we checked in the Portal these subscriptions had a status of “Pending”. This happened on our production Power BI Report Server instance which is currently running the Sep 2019 release.

This was very strange as these subscriptions had been running for months and months without issue and just stopped all of a sudden. It was even more confusing as we had some reports with multiple subscriptions and some of the subscriptions were still working while others were stuck with a status of “Pending”.

With no other information to go on in the Portal I started looking through the log files. This was complicated in our case as we have over one and a half thousand users and hundreds of report subscriptions. We also have 2 instances of PBIRS (Power BI Report Server) behind a load balancer which means two sets of log files to search through.

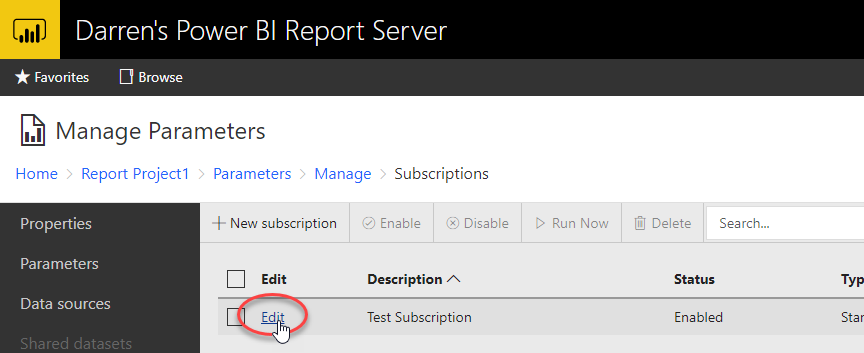
So I started by going to one of the pending subscriptions and clicking on the edit option

When you do this you will see the URL change to something like the following where there is a guid at the end with the SubscriptionId:

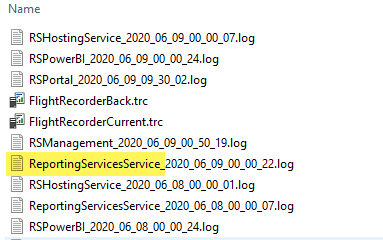
By default PBIRS writes a number of log files out to a folder at C:\Program Files\Microsoft Power BI Report Server\PBIRS\LogFiles If you look in this folder it will look something like the following with a bunch of different files with date stamps on the end. In this case because the issue is with a paginated report we need to look in the ReportingServicesService*.log files

What I found in one of the log files when I searched for the subscription Id was the following error

Error processing data driven subscription a743db7f-bbbe-4c45-9da1-2e2e286992dd: Microsoft.ReportingServices.Diagnostics.Utilities.UnknownUserNameException: The user or group name '<domain>\<contractor user>' is not recognized.

Where the <domain> was our company’s AD domain and <contractor user> was the login that had been used by a short term contractor that had worked with us to build the report in question.

In our case the account in question had been disabled when the contractor left the organization. So obviously nothing was checking the enabled state of this account.

But as it turns out that our AD team had done one of their periodic clean-ups yesterday where they actually deleted a whole group of disabled accounts. So it appeared that this was related somehow to this account no long existing in AD.

We already knew from years of working with Reporting Services that when a subscription is executed that the Owner of the subscription is checked to make sure a valid account is specified. (I believe this is possibly a security measure to stop people setting up a schedule to send reports to somewhere after they have left a company). However we already had the contractor set the subscription owner to one of our service accounts when they created the subscription to try and prevent this very scenario from happening.

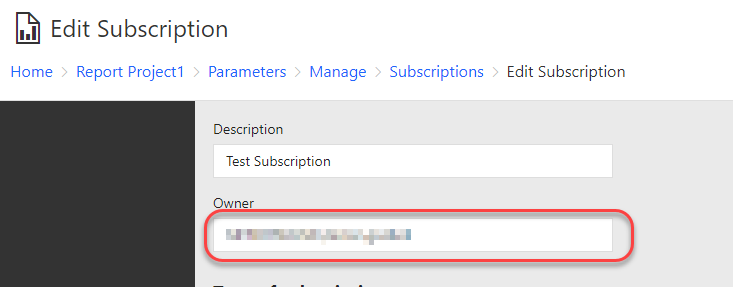
In fact searching through all the properties for the subscription in the portal showed no sign of the <contractor user> account anywhere.

At this point I decided to open up a PowerShell window and use one of the tools from the ReportingServicesTools PowerShell module to see if that could shed any more light on this issue.

When I ran the Get-RsSubscription cmdlet I noticed the following:

Sitting in the ModifiedBy property of the subscription object was a reference to our <contractor user> which we were seeing in the error in the log file.

When running Get-RsSubscription against a report where some subscriptions were working and others were stuck in a “Pending” state I could see that the working subscriptions had a ModifiedBy of an account belonging to someone who still had an active account in AD.

My guess as to what is happening here is that Report Server is attempting to populate some of the properties of a user object from Active Directory and is failing now that the users has been physically deleted and this is throwing an exception that is preventing the entire subscription from continuing with it’s execution.

So if you only have a handful of subscriptions stuck in a pending state like this you can just edit them in the portal and make some non-functional change like adding a full stop to the end of the subscription name. This will set the ModifiedBy to your user account and the subscription will start working again.

In our case we took a backup of the ReportServer database and then ran an update statement to set the guid of the ModifiedBy to the guid of our service account user. This is not a supported activity and something you would do at your own risk. But in our case it did allow us to quickly fix numerous “broken” subscriptions that would have taken hours to fix through the UI.

Power BI Report Server needs an Admin Portal

I think one area where Power BI Report Server could do with some more work is in the area of administrator tools. At the moment if a report fails to render because of an error you have to wait for a user to report it. And if a subscription fails to send there is no central place where you can see these issues and easily take steps to correct them.

DAX Studio 2.11.0 Released

The 2.11.0 release of DAX Studio is now available and brings with it the following new features and fixes.

New Preview Features

There are 2 new preview features this month, so you need to go into Options > Advanced and enable them if you want to use them

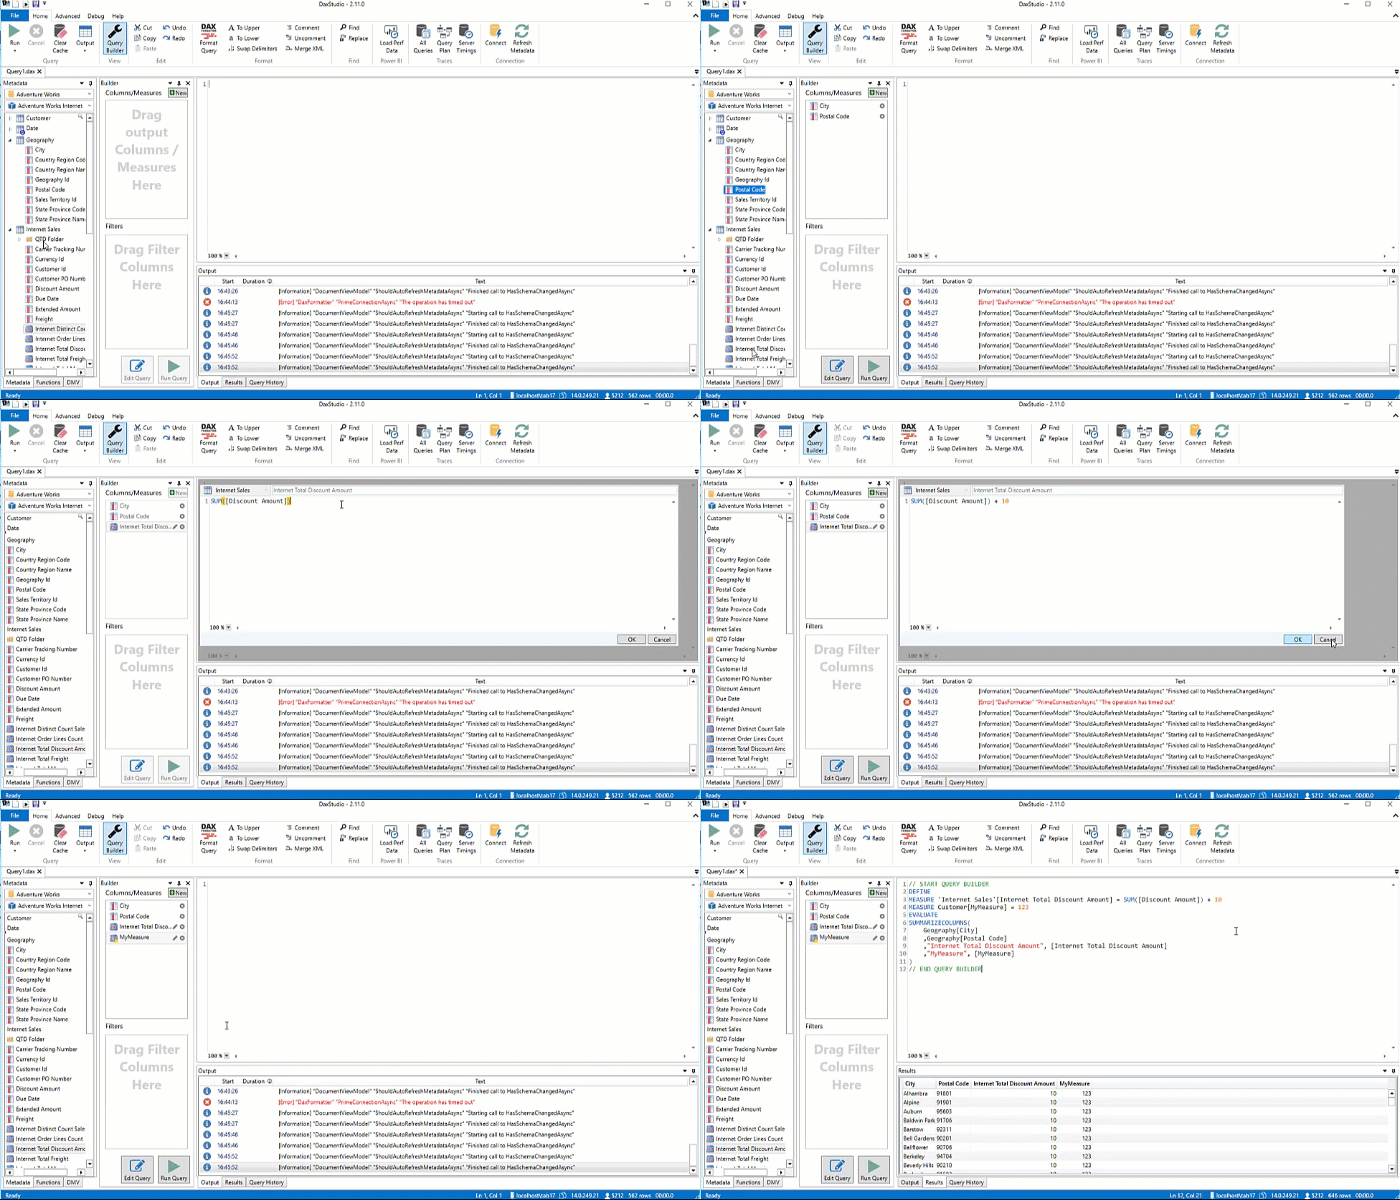
Query Builder

When enabled, the Query Builder appears as a button in the main ribbon

It lets you drag and drop columns and measures to build up a query which can include basic filters. You can also add custom measures or override the expression of a measure from your data model.

Query Builder animation

You can either run the content of the query builder directly or you can click the “Edit Query” button to send the text for the query to the main editor window where you can run it or further customize it.

Query Benchmark

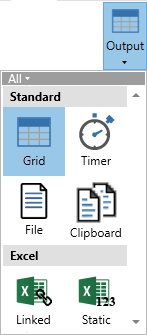
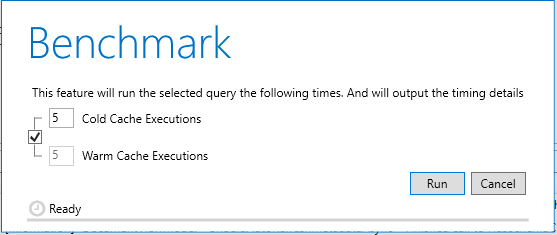
The Query Benchmark tool appears as a button on the Advanced ribbon. It allows you to run a given query a number of times both against a cold and warm cache. This is useful because even on a quiet development server there can be a number of factors that can cause variability in the server timings.

The Benchmark feature makes use of the Server Timings functionality to record detailed information about each query execution.

You get the option of how many runs of cold vs warm cache (and by default these are linked)

The output of a Benchmark run shows a summary view with the Avg, StdDev, Min and Max of both runs for the Total Duration and the Storage Engine Duration

The detailed output shows the timings of every single query execution.

New Features

In addition to the two big features above there are a number of smaller features that have been added in 2.11.0

  • #314 Added 3 Quick Access buttons for
    • New
    • New (with current connection)
    • Save
  • #277 Added Export button to all trace outputs
  • Added full filename tooltip to tabs (thanks @dmarkle)
  • Promoted View Metrics (Vertipaq Analyzer) from preview status to general availability
  • Promoted Export Data feature from preview status to general availability
  • Documentation Updates:
    • Added license page
    • including a section on SmartScreen issues in Win10 (thanks to Gilbert at fourmoo.com )
  • Updated syntax highlighting to align with DaxFormatter.com
  • Added a note in the Database tooltip that the Database Id can be copied using a right-click
  • Added formatting to shorten asazure: and powerbi: server names in the status bar so that the key information is visible
  • Added a partitions tab to the Model Metrics views
  • Added a sample of any missing keys to the relationships tab in the Model Metrics (these keys are not saved for privacy reasons when exporting to a vpax file)

Fixes

  • fixed cancelling of exports to SQL Server
  • improved keyboard navigation by adding IsDefault/IsCancel properties to dialog buttons (thanks @dmarkle)
  • fixed an issue with intellisense not re-enabling after reconnecting (thanks @dmarkle)
  • fixed an issue with Query History pane not updating the “Current” Database filter when changing databases
  • disabled external tools when connected to PowerPivot
  • #290 updated all URL references to use https (thanks @warthurton)
  • #291 fixed issue connecting from Excel 2010
  • #301 refined the code completion to prevent it overwriting code when editing in the middle of an expression
  • #302 disabled column re-ordering in Metrics view
  • #303 fixed an issue with the metadata pane when connecting to a model with dynamic format strings defined in calculation groups
  • #308 removed backtick characters in column names with spaces where using the Static Excel output
  • #320 fixed server not found error when exporting vpax file for PowerPivot models
  • #325 fixed error when attempting to connect to PowerPivot files stored on OneDrive
  • #329 fixed incorrect database name shown when launched from the Excel addin and not connected to PowerPivot
  • #330 fixed the status message getting stuck after writing output to a file destination
  • #339 fixed a bug that reported an assembly load error when Cancelling a query

DAX Studio: How measure formatting works

Have you ever run a DAX query from DAX Studio (or using a DAX window in SSMS) and wondered why the format you set on a measure does not always seem to get applied?

Let’s start with the following simple DAX query which simply lists the month number from 1 to 12 and a measure.

EVALUATE
ADDCOLUMNS(VALUES('date'[Month])
,"Internet Total Sales"
, [Internet Total Sales]
)

If we run this in DAX Studio you will see the following:

Note how the Format of the measure is correctly applied to return the dollar sign and the thousand separator and only 2 decimal places.

Now lets run the same query against the same model using SQL Server Management Studio (SSMS)

Now we have no currency symbol, no thousand separator and 3 to 4 numbers after the decimal place. What is going on here?

Well I’m going to let you in on a little secret about DAX queries:

The results in a DAX query are always returned unformatted.

You may well ask “Why is the formatting working in DAX Studio then?“. The answer is simple, I’ve specifically added code that looks at the column names returned by a query and then looks for a measure with the same name and applies any format string it finds.

You’ll notice in the example query that I’m setting the column name to the same name as the measure. If I change the column name to “AAA” you will see the following output.


Which is the same “raw” format we see from SSMS.

And if we exploit this for evil purposes we can even change the column name in the output to match a completely different measure. In the screenshot below I am applying the “Margin %” format to the [Internet Total Sales] measure so that it has one decimal place and a percentage sign and the decimal place is shifted two points to the right. I can’t think of a practical use for this behaviour, but you may see it occasionally if you are editing a query and change the measure reference without updating the column name.

You usually never see this in a client tool like Power BI as it builds the DAX queries internally so it knows which measures map to a given column in the result set so it can then apply the formatting appropriately.

If you’ve been following along with some of these example queries there is one other formatting feature we have in DAX Studio which you may have run into and that is the “Automatically Format Results” setting under File > Options.

This is off by default, but if you switch it on DAX Studio will apply some basic formatting based on the data type of the column in an attempt to try and make the results easier to read.

If the column is an integer use the format string “#,0” (this should include the appropriate thousands separator based on the language settings of your pc)

If the column is a decimal use the format “#,0.00”

If the column is a decimal number AND the name includes “pct” or “%” then use the format “0.00%”

This formatting of results is just one of the many small ways that I try to improve the user experience when working with queries in DAX Studio.

Power BI: How to make the Gantt chart show events in progress

I had a colleague approach me at work with an interesting problem. He had a Power BI report using the Gantt chart custom visual however when he used a date slicer to select a date range it was only showing events which started on that date range and he wanted to see any events that were in progress for that date range.

I figured out a way to get this working and I thought it might be helpful to not just show the solution, but also to walk through the process I used to develop it. Let’s start by looking at an example of the issue he was dealing with.

Given the following data, what he wanted was to filter the data for dates between Mar-20 to Apr-10 so that the Gantt chart would show the section in Yellow below:

But he was getting output like the following, where it was only showing the bottom 3 tasks from the image above with a start date between Mar-20 and Apr-10. It was not showing tasks which were already in progress like the first two (Division… and Functional…).

To figure out what options we had to change this default behaviour I turned on the Performance Profiler in Power BI Desktop (I could also have used the All Queries trace in DAX Studio). This captured the following query for the Gantt visual:

// DAX Query
DEFINE VAR __DS0FilterTable = 
  FILTER(
    KEEPFILTERS(VALUES('Table1'[Start Date])),
    AND('Table1'[Star Date] >= DATE(2016, 3, 20), 'Table1'[Start Date] < DATE(2016, 4, 11))
  )

EVALUATE
  TOPN(
    1002,
    SUMMARIZECOLUMNS(
      'Table1'[Task Name],
      'Table1'[Task ID],
      'Table1'[Start Date],
      'Table1'[Resource],
      __DS0FilterTable,
      "MinEnd_Date", CALCULATE(MIN('Table1'[End Date]))
    ),
    'Table1'[Task ID],
    1,
    'Table1'[Task Name],
    1,
    'Table1'[Start],
    1,
    'Table1'[Resource],
    1
  )

ORDER BY
  'Table1'[Task ID], 'Table1'[Task Name], 'Table1'[Start], 'Table1'[Resource]

There are two important parts to notice from the above query.

First is that the filter is currently explicitly filtering for start dates based on the values selected in the slicer. Obviously this is going to cause an issue as events that are already in-progress will have a start date before the earliest date in the slicer.

To fix this we need to create a separate date table that does not have a relationship to our main fact table. In the demo file I simply created a calculated table using Date Slicer = CALENDARAUTO() but you can use whatever method you like to create this table.

If we replace the 'Table1'[Start Date] field used in the slicer that “fixes” our issue of start dates earlier than those in the slicer being filtered out, but now our slicer is not filtering the data at all, but all is not lost, we will fix that next.

The second interesting thing that I noticed from the captured query is that [Start Date] is being used as a grouping column in the SUMMARIZECOLUMNS() function, but [End Date] is getting the earliest end using CALCULATE(MIN('Table1'[End Date])). What is happening is that the Gantt chart is creating an implied measure when we pass in the [End Date] column. So instead of letting the Gantt chart create an implied measure we can create our own measure and use that instead.

Below is the measure I developed

Gantt End Date = 
VAR _maxDate =
    MAX ( 'Date Slicer'[Date] )
VAR _minDate =
    MIN ( 'Date Slicer'[Date] )
VAR _tasks = VALUES(Table1[Task ID])
RETURN
    MAXX (
        CALCULATETABLE (
            SUMMARIZE( Table1, Table1[Start Date], Table1[End Date] ),
            Table1[Start Date] <= _maxDate,
            Table1[End Date] >= _minDate,
            _tasks
        ),
        Table1[End Date]
    )

This gives us the following

If you look at the output of this measure in a table all it does is the following:

Note that I’ve force the display of all rows by including a simple row count measure. This lets us see that the [Gantt End Date] only returns values where the End date is after the start of the selected date range and the start is before the end of the selected date range, otherwise it returns a blank and SUMMARIZECOLUMNS does not return rows where all the measures return blank.

If you want to look at the Power BI file I used in the screenshots for this post you can download it from here

Do the ALL() and REMOVEFILTERS() functions always work correctly in DAX?

I was recently re-reading through Matt Allington’s post that he did back when the REMOVEFILTERS() function was first introduced into the DAX language and I saw this post in the comments:

If a report is set up using the filter panel instead of slicers, will these filtering functions (ALL, REMOVEFILTERS, FILTER, ALLSELECTED, etc.) work as expected? For example if reporting percentages will the denominator calculate correctly?

John Thomas

Now it does not really matter if filter conditions are set using slicers or the filter panel. At the end of the day they get injected into the DAX query for a visual in the same way. You can check this yourself by creating a test file with 2 pages with the same visual, one with a slicer and the other with a page filter, then use the Performance Analyzer or the All Queries trace in DAX Studio to see the DAX query generated by both pages for that visual.

So the simple answer to this question is “yes” – if the filters work with slicers, they will work with the filter panel.

BUT, the astute among you may have noticed that I’ve qualified my answer by adding if the filter conditions work with slicers”. Which might lead you to wonder- “Are there scenarios where the filter conditions don’t work?”. And when we are talking about filter modifiers like ALL() and REMOVEFILTERS() there are some scenarios where the results may be unexpected due to the way the the SUMMARIZECOLUMNS() function correlates filters from the same table together. If you want to find out more I suggest the you read through this article by Greg Baldini over on antifound.com which contains an in-depth analysis of this issue.

« Older posts Newer posts »