DAX Studio 2.17.2 has just been released and the following is a run down of the new features and fixes that you will find in this release.
Apologies to anyone who attempted to download the 2.17.0 release – there was an update to the code signing tool and it failed to correctly sign the installer. The automated build has now been fixed so that it correctly signs the installer again.
New Features
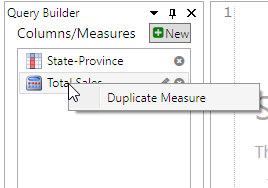
Added Parameter support to Query Builder filters
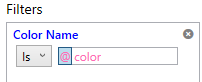
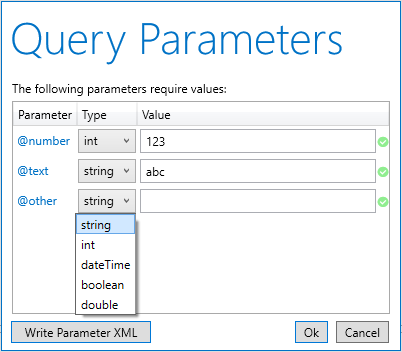
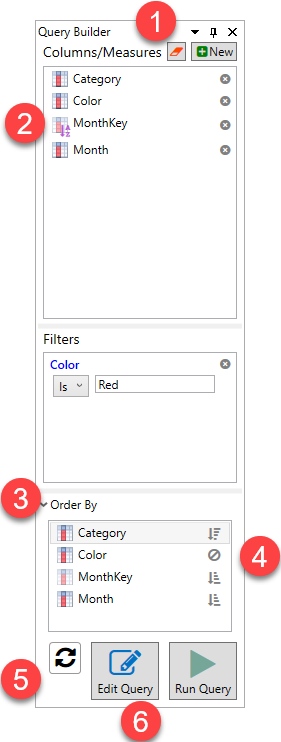
The Query Builder now supports parameters. Typing an @ as the first character in a query builder filter value will switch the value into parameter mode and the following text will be treated as the parameter name. (typing @ a second time or clicking on the purple @ button will toggle the parameter back to the standard value mode)
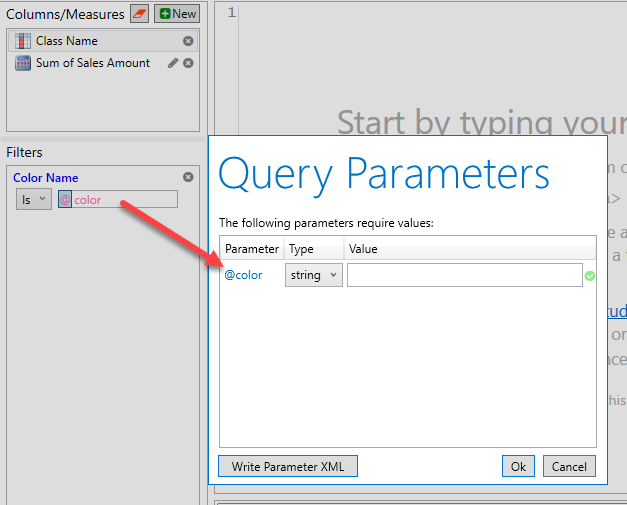
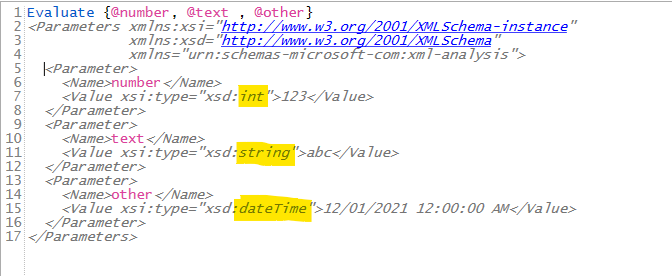
When you run the query builder where a filter has a parameter you will be prompted for the parameter value just as if you had typed out a query that included a parameter reference. This allows you to build a query with parameters that can be pasted into a paginated report or any other tool that supports DAX parameters.
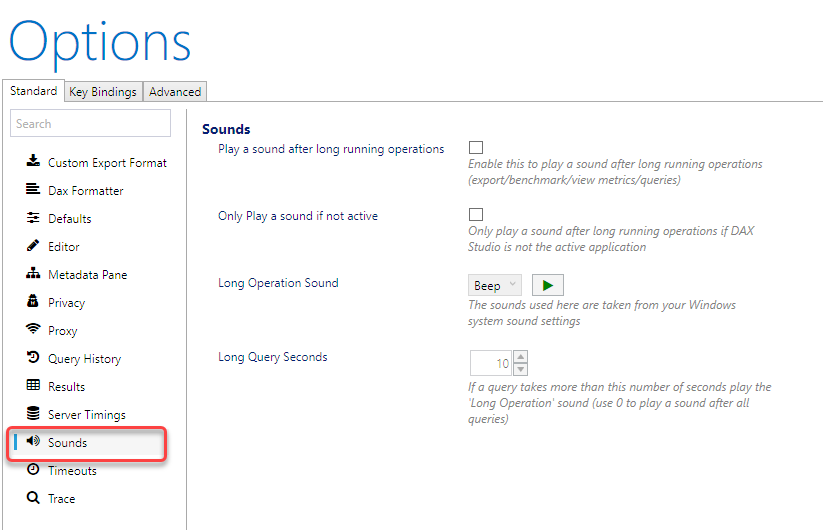
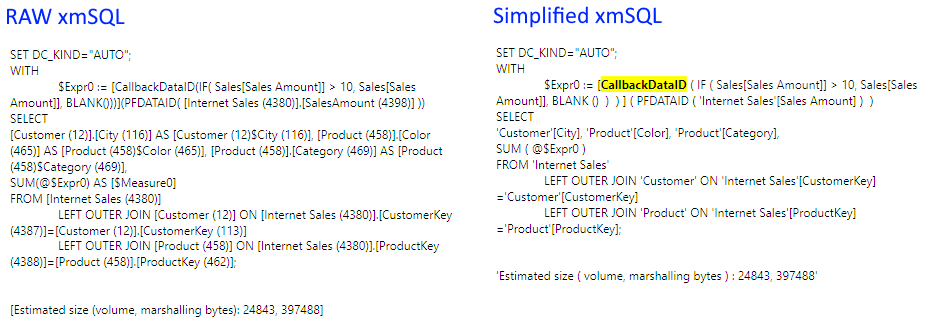
Removing <pii> tags from xmSQL in Server Timings to improve readability
Power BI and AzureAS have added <pii> tags around some of the text in the query events that DAX Studio captures as part of the Server Timings. These tags allow Microsoft to strip out information that could potentially be personally identifiable when writing them to centralized logs. But because DAX Studio does not send any of this information off your machine and because this information also includes important contextual information for troubleshooting and performance tuning we are just removing these tags to reduce the noise and improve readability.
Fixing accuracy of Server Timings for queries with Batch events
Prior to this update Storage Engine batch events timings were not being added to the SE duration figures. For a lot of models this difference is insignificant, but for large queries against large models this can result in an incorrect inflation of the FE duration. Keep an eye on the posts from Marco and Alberto at sqlbi.com as they are working on an in-depth video to explain this improvement to the Server Timings.
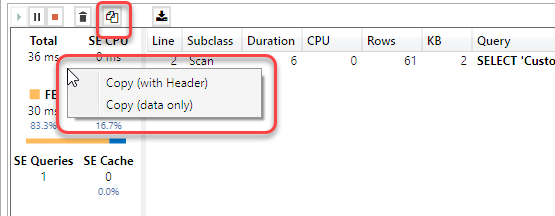
Query Builder queries are now captured in the query history
Prior to this update the Query History pane was only capturing the text of queries that had been typed into the query editor. Now the Query History pane captures any query that was executed regardless if it was from the edit window or from the Query Builder.
There is now an icon next to each query history row indicating where it was captured from and if you double click on a query that was originally run in the Query Builder it will be restored back into the Query Builder window
The /f parameter can now open vpax files
Now when you run DAX Studio from the command prompt the /f parameter will open either .dax or .vpax files.
Added extra information to the error message when the XMLA endpoint is not correctly enabled
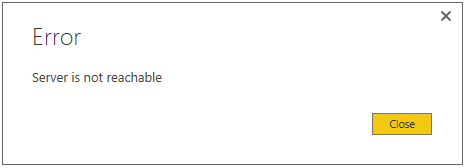
If the Power BI XMLA endpoint is not properly enabled the Microsoft ADOMD provider returns a very generic error message making it hard to know what has gone wrong. DAX Studio now adds some extra text after the Microsoft error if you are attempting to connect to an XMLA endpoint and hit this generic WebException error to suggest you check the XMLA endpoint settings in your tenant.
Improved caching of measure expressions
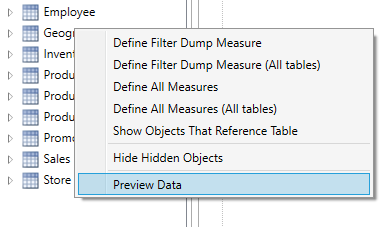
Prior to this update features that required access to the text of the multiple measure expression such as the “Define All Measures” feature would request the expression text one at a time, now all of the measure expressions are retrieved in a single request.
Fixes
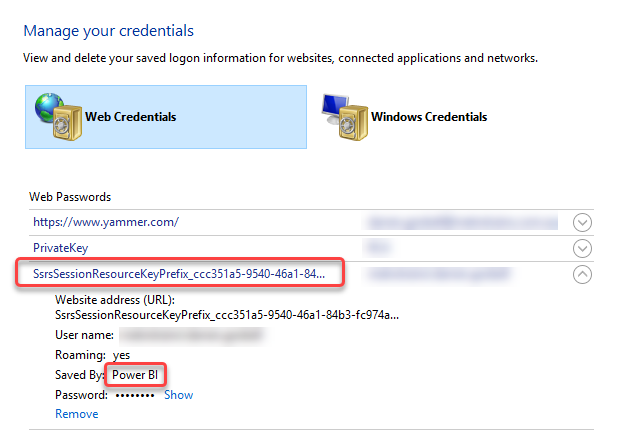
- Fixed #703 preventing a crash when entering a proxy password
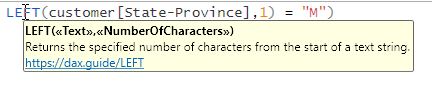
- Fixed #715 added DOUBLE data type to intellisense and syntax highlighting
- Fixed #740 export to Excel failed on some machines
- Fixed #755 saving parameters to XML was not correctly encoding special characters
- Fixed #750 would crash on startup if the WMI information on the machine was corrupt
- Fixed download link in Help – About screen


Recent Comments