Sometimes when you have a slow paginated report it’s hard to know where to start in order to improve the performance.
There is a feature in Paginated Reports on the Power BI service that was released a number of months ago which will show you a breakdown of the performance of that report.
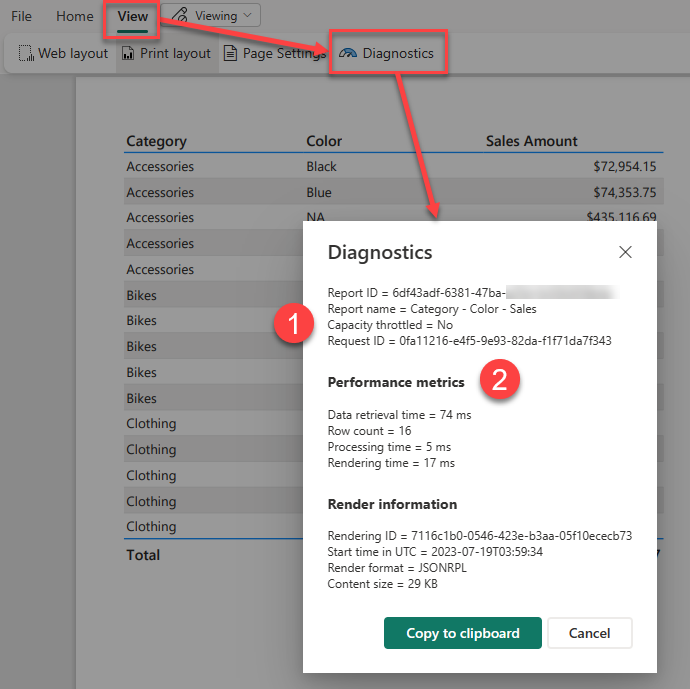
After you have run your report you can access this feature by going into the View menu and clicking on the Diagnostics button

Power BI Report Server and SQL Server Reporting Services do not have this button on the report itself, but you can get the same timing information by querying the ExecutionLog3 view in the ReportServer database (see Report Server ExecutionLog and the ExecutionLog3 View – SQL Server Reporting Services (SSRS) | Microsoft Learn)
This dialog shows us a number of pieces of interesting information about the report execution.
- Note the item at the top here which says “Capacity throttled = no” this applies to premium capacities and tells you if the capacity is currently in a throttled state. This is important as throttling adds a delay to interactive operations like report rendering and so your report may have slow performance because previous operations on the capacity have put it into a throttled state.
- This second section of the report shows you a breakdown of the different category of operations in the report as well as a count of the total dataset rows that were processed.
If you want to understand what is happening during each step of the performance metrics, I found the following information in this archived blog post from a former member of the SSRS team which breaks down the operations which go into each of these 3 categories.
Data Retrieval Time
The number of milliseconds spent interacting with data sources and data extensions for all data sets in the main report and all of its subreports. This value includes:
- Time spent opening connections to the data source
- Time spent reading data rows from the data extension
Note: If a report has multiple data sources/data sets that can be executed in parallel, TimeDataRetrieval contains the duration of the longest DataSet, not the sum of all DataSets durations. If DataSets are executed sequentially, TimeDataRetrieval contains the sum of all DataSet durations.
Processing Time
The number of milliseconds spent in the processing engine for the request. This value includes:
- Report processing bootstrap time
- Tablix processing time (e.g. grouping, sorting, filtering, aggregations, subreport processing), but excludes on-demand expression evaluations (e.g. TextBox.Value, Style.*)
- ProcessingScalabilityTime**
Rendering Time
The number of milliseconds spent after the Rendering Object Model is exposed to the rendering extension. This value includes:
- Time spent in renderer
- Time spent in pagination modules
- Time spent in on-demand expression evaluations (e.g. TextBox.Value, Style.*). This is different from prior releases, where TimeProcessing included all expression evaluation.
- PaginationScalabilityTime**
- RenderingScalabilityTime**
** The “scalability” times are when the engine does extra operations to free up memory in response to memory pressure issues during processing, pagination or rendering
Optimizing Report Performance
If you are interested in ways to optimize the performance of a paginated report, then many of the techniques outlined in this old article are still perfectly valid even though it was written for SQL 2008R2 – you can just ignore some of the points that are specific to on-prem scenarios like point 2 using Shared Data Sources which are not available in the Power BI service.
Leave a Reply