Darren Gosbell

Tag: powerbi

Diagnosing Performance of Paginated Reports in Power BI

Sometimes when you have a slow paginated report it’s hard to know where to start in order to improve the performance.

There is a feature in Paginated Reports on the Power BI service that was released a number of months ago which will show you a breakdown of the performance of that report.

After you have run your report you can access this feature by going into the View menu and clicking on the Diagnostics button

The Paginated Report Diagnostics dialog

Power BI Report Server and SQL Server Reporting Services do not have this button on the report itself, but you can get the same timing information by querying the ExecutionLog3 view in the ReportServer database (see Report Server ExecutionLog and the ExecutionLog3 View – SQL Server Reporting Services (SSRS) | Microsoft Learn)

This dialog shows us a number of pieces of interesting information about the report execution.

  1. Note the item at the top here which says “Capacity throttled = no” this applies to premium capacities and tells you if the capacity is currently in a throttled state. This is important as throttling adds a delay to interactive operations like report rendering and so your report may have slow performance because previous operations on the capacity have put it into a throttled state.
  2. This second section of the report shows you a breakdown of the different category of operations in the report as well as a count of the total dataset rows that were processed.

If you want to understand what is happening during each step of the performance metrics, I found the following information in this archived blog post from a former member of the SSRS team which breaks down the operations which go into each of these 3 categories.

Data Retrieval Time

The number of milliseconds spent interacting with data sources and data extensions for all data sets in the main report and all of its subreports. This value includes:

  • Time spent opening connections to the data source
  • Time spent reading data rows from the data extension

Note: If a report has multiple data sources/data sets that can be executed in parallel, TimeDataRetrieval contains the duration of the longest DataSet, not the sum of all DataSets durations. If DataSets are executed sequentially, TimeDataRetrieval contains the sum of all DataSet durations.

Processing Time

The number of milliseconds spent in the processing engine for the request. This value includes:

  • Report processing bootstrap time
  • Tablix processing time (e.g. grouping, sorting, filtering, aggregations, subreport processing), but excludes on-demand expression evaluations (e.g. TextBox.Value, Style.*)
  • ProcessingScalabilityTime**

Rendering Time

The number of milliseconds spent after the Rendering Object Model is exposed to the rendering extension. This value includes:

  • Time spent in renderer
  • Time spent in pagination modules
  • Time spent in on-demand expression evaluations (e.g. TextBox.Value, Style.*). This is different from prior releases, where TimeProcessing included all expression evaluation.
  • PaginationScalabilityTime**
  • RenderingScalabilityTime**

** The “scalability” times are when the engine does extra operations to free up memory in response to memory pressure issues during processing, pagination or rendering

Optimizing Report Performance

If you are interested in ways to optimize the performance of a paginated report, then many of the techniques outlined in this old article are still perfectly valid even though it was written for SQL 2008R2 – you can just ignore some of the points that are specific to on-prem scenarios like point 2 using Shared Data Sources which are not available in the Power BI service.
Setting a dynamic default slicer value in Power BI

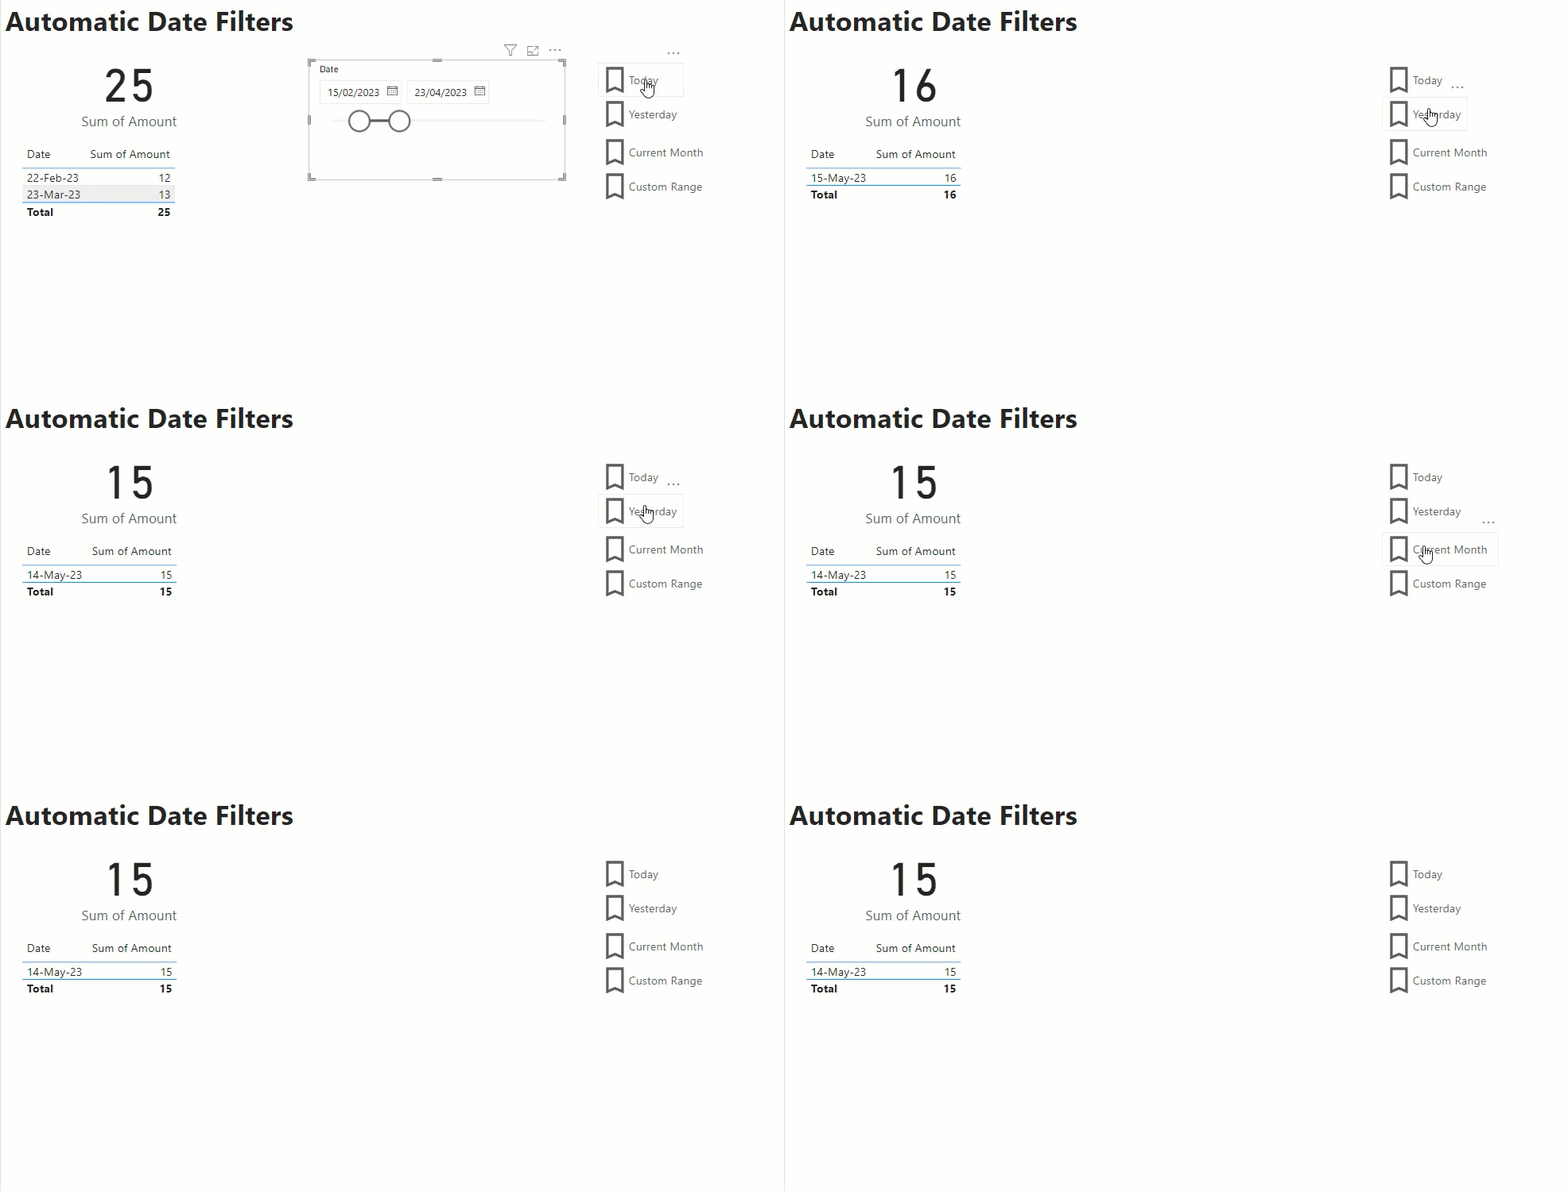
Currently Power BI does not support a way for dynamically setting a default value for a slicer using an expression. One common example of where this sort of capability would be really useful is if you have a dashboard that you want to default to show the current day’s data by default, but you want the user to be able to select a custom date filter if they so desire.

While I could go into my report and set a slicer to filter it for today’s date of 15 May 2023. When I open the report tomorrow this slicer will still have the hard coded value of 15 May 2023. You could potentially create measures that use something like: CALCULATE([Sales], 'Calendar'[Date] = Today() ) there are a number of problems with this. While it will automatically show the Sales amount for the value of Today() – the problem is that on the Power BI Service “Today” is set based on the UTC time. So depending on what timezone you are in the day can change part way through your working hours.

While there currently is no built-in way of configuring this within a slicer itself this there are workarounds and I’m going to walk you through one approach that I’ve used in the past. This approach has a couple of moving parts. The first one is that as part of a nightly data load process I update a number of columns in a shared “Calendar” table.

Implementation

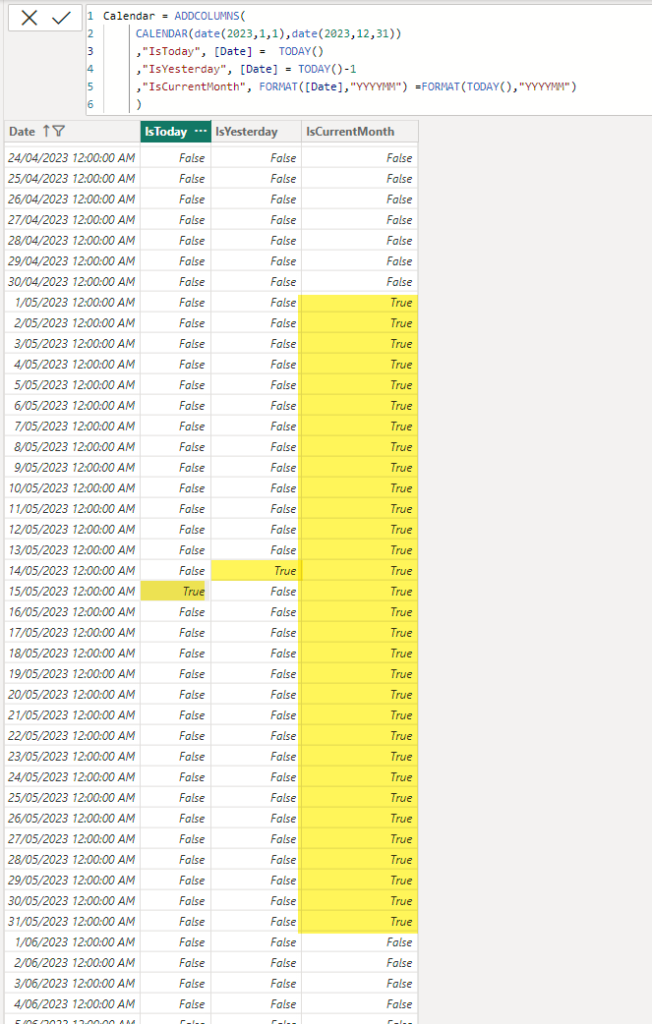
In the example below I’ve added 3 indicator columns for IsToday, IsYesterday and IsCurrentMonth. This post was published on 15 May 2023 so for that date the IsToday column has a value of True.

NOTE: I’ve simulated this in a simple Power BI example using a calculated table, but you need to be very careful using a calculated table in a production scenario since the Power BI service runs in UTC time so depending on when your data transforms get run your indicator columns could be updated incorrectly.

Once I’ve built out the body of my report, adding visuals and slicers I create 4 bookmarks:

  1. Custom Range – this has no report level filters and has my date slicer set as visible
  2. Today – this has a report level filter for IsToday=True and sets the date slicer to hidden
  3. Yesterday – this has a report level filter for IsYesterday=True and sets the date slicer to hidden
  4. Current Month – this has a report level filter for IsCurrentMonth=True and sets the date slicer to hidden

Then I add add 4 buttons to my report, one for each of the bookmarks above. Then as I click on each button it changes the filtering appropriately.

If I save and publish my report with the Today bookmark selected this means that each night when my data load routine is run, and my data model is refreshed the IsToday column is updated. Then the next morning when my users open the report they see the data automatically filtered for the current date. And if they wish to view some other date, I have a set of handy short cuts for common date filters, or they click on the Custom Range option to set their own custom filter.

Limitations

Where this approach falls down a bit is when you have multiple pages in your report, and you want the date filters to affect all the pages. For the indicator columns it’s easy enough to set the filters linked to your bookmarks as report level filters. And you can setup your “custom range” slicer as a sync’ed slicer so that it affects multiple pages. The tricky bit comes with the showing and hiding the slicer as you can only show and hide a visual on the current page with a bookmark.

The approach I chose to take was to make the “Custom Range” bookmark have the “Current page” option set so that the user was always returned to the first page in the report if they selected that option. It’s not ideal, but otherwise you would need different “Custom Range” bookmarks per page and it just gets a bit messy.

Setting MaxParallelismPerQuery on a Power BI Dataset using Tabular Editor

If saw this announcement last month – Query parallelization helps to boost Power BI dataset performance in DirectQuery mode | Microsoft Power BI Blog | Microsoft Power BI – about the new MaxParallelismPerQuery setting and you were interested in testing, but you were not sure how to run the sample code then read on.

The sample code in the blog post above is a full .net program that you could compile and run from Visual Studio or from the command line compiler. But that is something that not all BI developers are comfortable doing. If you are able to use Tabular Editor then there is a much simpler way to change this setting.

  1. Launch Tabular Editor and connect to the XMLA endpoint for your workspace (so this requires a premium workspace).
  2. Select the dataset you wish to test.
  3. Paste the code below into the “C# Script” tab in TE2 or open a new C# Script document in TE3. The sample script sets the parallelism to 10, you can experiment with different values by changing the value in the last line of the script.
  4. Then click the run button.
  5. Finally click the save button to save this change back to Power BI

If you cannot see the code above you can download it directly from here: TabularEditorSetMaxParallelism.csx (github.com)

And once you have updated the compatibility setting of the database you can also change the Max Parallelism Per Query setting directly from the model explorer in Tabular Editor

Fixing incorrect date formats in Power BI Report Server when using Chrome or Firefox

Reposted from 1 Mar 2019 from my old blog since geekswithblogs.net is down again at the moment: http://geekswithblogs.net/darrengosbell/archive/2019/03/01/fixing-incorrect-date-formats-in-power-bi-report-server-when.aspx

We are using Power BI Report server to publish Power BI Reports internally. And being in Australia we use a “sensible” date format of dd/mm/yyyy Smile 

However at a recent showcase with some of our end users they commented that our date format was “backwards” ie. mm/dd/yyyy

If you are using US regional settings on your PC you probably have not come across this issue, but for other regions this can be a problem.

Upon getting back to my desk I checked the report in Power BI Desktop and the date format was correctly picking up my local regional settings. I then opened the report in IE (which is what most of our End Users have as a default browser) and the report was still using the Australian format (dd/mm/yyyy):

DateSlicer-IE

However when opening the same report in Chrome or Firefox the date was using US regional settings (mm/dd/yyyy):

DateSlicer-Chrome

After doing some google/binging I found that both Chrome and Firefox have their own internal regional settings dialog and they both default to using US settings.

If you go into the Settings menu in Chrome and search for “Language” you will find the following, and it’s not just the default display language that matters the order is also important. Moving “English (Australia)” to the top of the list, then deleting cached images and files fixed this issue.

RegionalSettings-Firefox

Clicking on the 3 dots to the right of the language gives you an option to move that language to the top.

Firefox has a very similar language dialog and the same fix works for it too.

What this does behind the scenes is to change the “Accept-Language” headers that the browser sends to PBIRS to make your preferred language first in the list. This in turn alters the regional formatting setting javascript file that is sent down to the browser. Before this change I could see a file called angular-locale_en-us.js being used, after the change I now see angular-locale_en-au.js

Power BI Report Server – fixing Pending subscriptions

Last week I came across an issue where a number of our paginated report subscriptions at work failed to go out. When we checked in the Portal these subscriptions had a status of “Pending”. This happened on our production Power BI Report Server instance which is currently running the Sep 2019 release.

This was very strange as these subscriptions had been running for months and months without issue and just stopped all of a sudden. It was even more confusing as we had some reports with multiple subscriptions and some of the subscriptions were still working while others were stuck with a status of “Pending”.

With no other information to go on in the Portal I started looking through the log files. This was complicated in our case as we have over one and a half thousand users and hundreds of report subscriptions. We also have 2 instances of PBIRS (Power BI Report Server) behind a load balancer which means two sets of log files to search through.

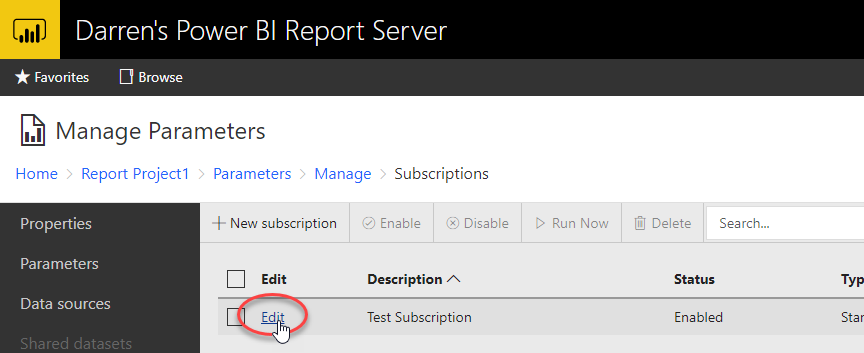
So I started by going to one of the pending subscriptions and clicking on the edit option

When you do this you will see the URL change to something like the following where there is a guid at the end with the SubscriptionId:

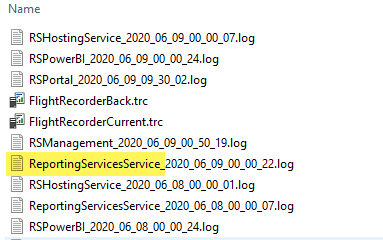
By default PBIRS writes a number of log files out to a folder at C:\Program Files\Microsoft Power BI Report Server\PBIRS\LogFiles If you look in this folder it will look something like the following with a bunch of different files with date stamps on the end. In this case because the issue is with a paginated report we need to look in the ReportingServicesService*.log files

What I found in one of the log files when I searched for the subscription Id was the following error

Error processing data driven subscription a743db7f-bbbe-4c45-9da1-2e2e286992dd: Microsoft.ReportingServices.Diagnostics.Utilities.UnknownUserNameException: The user or group name '<domain>\<contractor user>' is not recognized.

Where the <domain> was our company’s AD domain and <contractor user> was the login that had been used by a short term contractor that had worked with us to build the report in question.

In our case the account in question had been disabled when the contractor left the organization. So obviously nothing was checking the enabled state of this account.

But as it turns out that our AD team had done one of their periodic clean-ups yesterday where they actually deleted a whole group of disabled accounts. So it appeared that this was related somehow to this account no long existing in AD.

We already knew from years of working with Reporting Services that when a subscription is executed that the Owner of the subscription is checked to make sure a valid account is specified. (I believe this is possibly a security measure to stop people setting up a schedule to send reports to somewhere after they have left a company). However we already had the contractor set the subscription owner to one of our service accounts when they created the subscription to try and prevent this very scenario from happening.

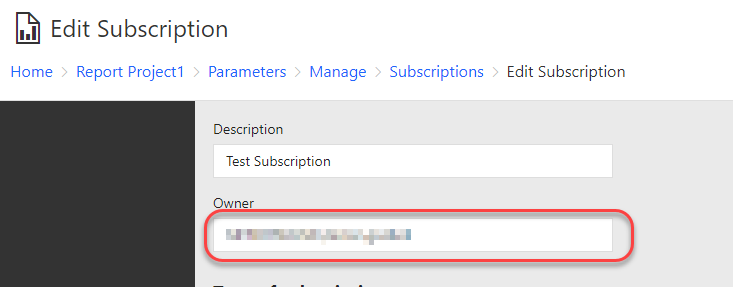
In fact searching through all the properties for the subscription in the portal showed no sign of the <contractor user> account anywhere.

At this point I decided to open up a PowerShell window and use one of the tools from the ReportingServicesTools PowerShell module to see if that could shed any more light on this issue.

When I ran the Get-RsSubscription cmdlet I noticed the following:

Sitting in the ModifiedBy property of the subscription object was a reference to our <contractor user> which we were seeing in the error in the log file.

When running Get-RsSubscription against a report where some subscriptions were working and others were stuck in a “Pending” state I could see that the working subscriptions had a ModifiedBy of an account belonging to someone who still had an active account in AD.

My guess as to what is happening here is that Report Server is attempting to populate some of the properties of a user object from Active Directory and is failing now that the users has been physically deleted and this is throwing an exception that is preventing the entire subscription from continuing with it’s execution.

So if you only have a handful of subscriptions stuck in a pending state like this you can just edit them in the portal and make some non-functional change like adding a full stop to the end of the subscription name. This will set the ModifiedBy to your user account and the subscription will start working again.

In our case we took a backup of the ReportServer database and then ran an update statement to set the guid of the ModifiedBy to the guid of our service account user. This is not a supported activity and something you would do at your own risk. But in our case it did allow us to quickly fix numerous “broken” subscriptions that would have taken hours to fix through the UI.

Power BI Report Server needs an Admin Portal

I think one area where Power BI Report Server could do with some more work is in the area of administrator tools. At the moment if a report fails to render because of an error you have to wait for a user to report it. And if a subscription fails to send there is no central place where you can see these issues and easily take steps to correct them.