Note: Make sure to go on and read part 2 after reading this which has some improvements to the script.
It seems like everyone is playing with ChatGPT at the moment and doing everything from getting it to write code for them to asking it to write ode’s to their favourite visuals. Writing DAX code is interesting from the perspective of someone building a data model. But one thing that has always been hard from the perspective of consumer of a data model is understanding the logic behind those DAX calculations.
As you’ve probably already guessed from the title of this post rather than generating DAX I wanted to see if we could go the other way and get ChatGPT to provide simple descriptions of what a DAX expression was doing.
To test this I did not want to use a basic measure, so I found a moderately complex expression that someone else had actually originally had ChatGPT generate for them and ask it to explain the calculation. The first time I tried this it produced a very long description breaking down each of the function calls. But by revising the way I asked the question I eventually got to a point where it was giving me a nice concise explanation.
When I posted the following question to ChatGPT:
Explain the following calculation in a few sentences in simple business terms without using DAX function names:
CALCULATE (
   SELECTEDVALUE ( 'Suppliers'[CompanyName] ),
   TOPN (
      1,
      SUMMARIZE (
         Products,
         'Suppliers' [CompanyName],
         "@StockValue", SUMX( 'Products'[UnitsInStock] * 'Products'[UnitPrice] ),
      [@stockValue],
       DESC
   )
)
It came back with the following answer which I was pretty happy with:
This calculation is finding the company name of the supplier with the highest total value of stock for a given product. It does this by first multiplying the units in stock by the unit price for each product, then summarizing that total value by supplier. It then finds the top supplier by that total value and returns their company name.This was great for a single measure, but not all of the consumers of your data model will have access to view the DAX expression. And even if they did it would be a pain to have to keep jumping out to an external website to understand what every measure is doing.
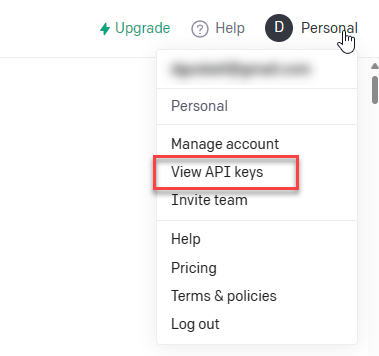
So this made me wonder if there might be some way of injecting these descriptions into the data model. And as it turns out ChatGPT already has a REST API. All you need to do is to sign up for an account at https://platform.openai.com (if you’ve been experimenting with ChatGPT you probably already have an account) and then generate an API key for your account and you can make requests of ChatGPT from another program.
Note: free accounts are limited to 20 calls per minute (see Rate Limits – OpenAI API ). So for large models you would either need to add logic to include a 1 minute delay every 20 measures or upgrade to a paid plan.
From there I setup the following Tabular Editor script which will loop through all of the measures in your data model and update the description with the one generated by ChatGPT. All you need to do to run this is to paste your own API key into the apiKey constant on line 8.
For illustration purposes I’ve also included the original DAX expression, but you don’t need to keep that if you don’t want to.
Note: the script has been tested in both TE2 (free) and TE3 (paid)
and is available as a gist on github https://gist.github.com/dgosbell/f3253c7ec52efe441b80596ffddea07cThe updated script including logic for dealing with rate limiting is included in my following post here
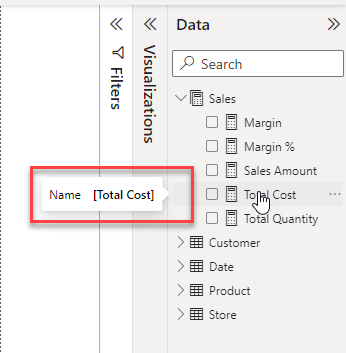
Before running the script hovering over a measure in my data model only shows the measure name
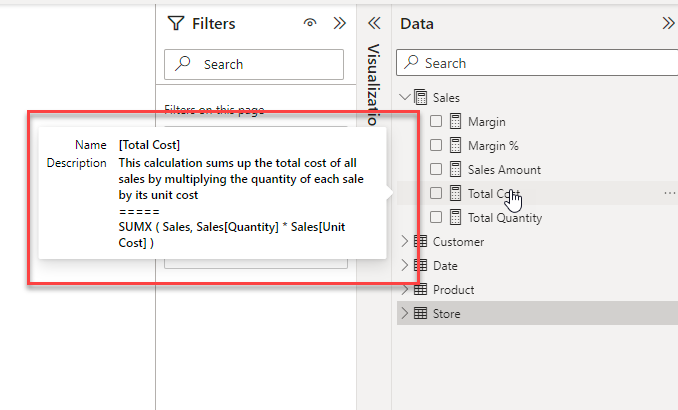
After running the script, you get a much more informative tooltip
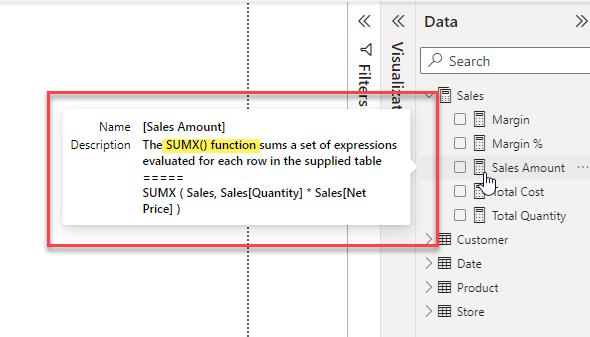
Interestingly the descriptions do seem to change a little bit from one run to the next and in spite of asking it not to use DAX function names in the description sometimes it still sneaks one in. The description below was particularly bad where it just described the SUMX function.
But the advantage of this technique is that you can re-run it for single measures if you like or you could manually edit the description field if the description needed a small improvement.
Update: 16 Feb 2023 – added note about API rate limiting
Update: 17 Feb 2023 – See part-2 here for short tutorials on how to run the script and an updated version which deals with the API rate limiting
Hi Darren,
That’s really cool, but where is the “Tabular Editor script”?
Thanks
Sorry, it appears the plugin that was displaying the gist does not work properly all the time. I’ve added a direct link to the post now
It’s amazing Darren, can you share the script?
Sorry the plugin for displaying the gist seems to not work all the time. I’ve added a direct link to it now.
Did you forget the tabular editor script?
I don’t see it in the article when looking at it on my phone.
Never mind the gist just slowed up.
Yes, the plugin that is showing the gist seems to have some issues. I’ve added a direct link to the gist in the post now as a backup.
I just used it AMAZING!!!!
Love this!
It’s always giving me error 420, too many requests. Anything I can do in the code to work around this error?
thanks!
error 429 i mean
A 429 error means you have hit the maximum rate limit for the API. I just checked and Free users are limited to 20 requests per minute. (see https://platform.openai.com/docs/guides/rate-limits/overview) so you could either add logic to pause for 1 minute for every 20 requests or you could upgrade to a paid plan.
Oh my gosh. I was wondering if this was possible and here it is! Thank you!!
You sir are a genius! This is INSANE! Will save so much time writing descriptions for enterprise models. I can’t believe it even interprets the meaning of column names.
Hey Darren, this looks good!!
I’m a new Tabular Editor user, can you explain how I can run your script from there? Sorry for the dumb question.
Haha, sorry, you can ignore my question… I just ask it to chatGPT, lol.
lol – well done!
Hi Darren,
Thanks for sharing these amazing techniques, but I getting “429 error too many requests” even I have tested on model with only 5 measures in it using both scripts?
Appreciate your help on this!
If you are using the upgraded script from my second post which includes the pause in between batches of calls I’m not sure what else to suggest as I don’t see this issue on my machine. You could maybe try generating a new API key in case your current one has been flagged for too many requests. Otherwise as this error is coming from OpenAI so maybe try contacting them.
This is really useful.
Thank you for sharing, Darren!
I tested the script on both large and small dataset.
Small datasets appear to be processed quite quickly, but even with an upgraded account, when I try to process a large dataset, I receive the 429 error.
Have a look at my follow-up post https://darren.gosbell.com/2023/02/generating-measure-descriptions-with-chatgpt-part-2/ which includes an updated script which will add a pause inbetween batches. If you’ve upgraded your account you may want to change the apiLimit variable to match the upgraded limits.
Hi, Darren! Thanks for this tool! I’ve paid a monthly usage of Open AI API just for this, and works great, but:
1. sometimes I recive an error 500 in the line 32: “res.Result.EnsureSuccessStatusCode();” – it’s random, not every time I do it.
2. How could I choose which measures I’d like to run it? If I have +50 measures, and I only document 10-15 of them… how could I do it?
Thanks again!
Error 500 is a server error. You’d need to ask the people at Open AI about that.
In terms of selecting specific measures you could use the script from my follow-up post here https://darren.gosbell.com/2023/02/generating-measure-descriptions-with-chatgpt-part-2/
Hi Darren,
Just wanted to say “wow” and thanks for sharing – really impressive!
I am seeing an error
Error on line 32
HttpRequestException
Response Statue code does not indicate success :
Is there more to that error message? Usually there should be an error code of some sort like a 429 if you have made too many requests or a 500 if there is a server side error.
Hi Darren,
Amazing work bud.
I have error 401 maybe do u know why ?
“response status is 401”
a 401 is an access denied error so this probably means you are not using a valid API Key. And make sure you read part 2 of this article which has some improvements to the script https://darren.gosbell.com/2023/02/generating-measure-descriptions-with-chatgpt-part-2/
Hi Darren,
Amazing work !!
i have 401 erorr mayne do u know how to fix it ?
“response status is 401”
Ty for the last answer, i have another quation pls,
“But the advantage of this technique is that you can re-run it for single measures if you like”
how can i re-run it for single measure ?
You can use the SelectedMeasures collection in Tabular Editor to do this. In the part 2 follow up to this post I have an updated script that checks for any selected measures and deals with the rate limit of the API https://darren.gosbell.com/2023/02/generating-measure-descriptions-with-chatgpt-part-2/
I have following question,
can we put the description into tool tip of metrics ?
like if we have visualization in our model who handle measure can we make it into the tool tip of the visualization to describe it in the tool tip ?
Metrics are stored outside of the data model. I don’t think they have a description property.
can you think on work around for this ?
even to put manually the tool tip
Hi!
Great code.
However text-davinci-003 is not in usage anymore. What would you substitute this for?
Thanks.
Based on the docs at openai https://platform.openai.com/docs/deprecations/2023-07-06-gpt-and-embeddings it looks like they recomment using gpt-3.5-turbo-instruct as the replacement for text-davinci-003
I wish it were better at writing articles.