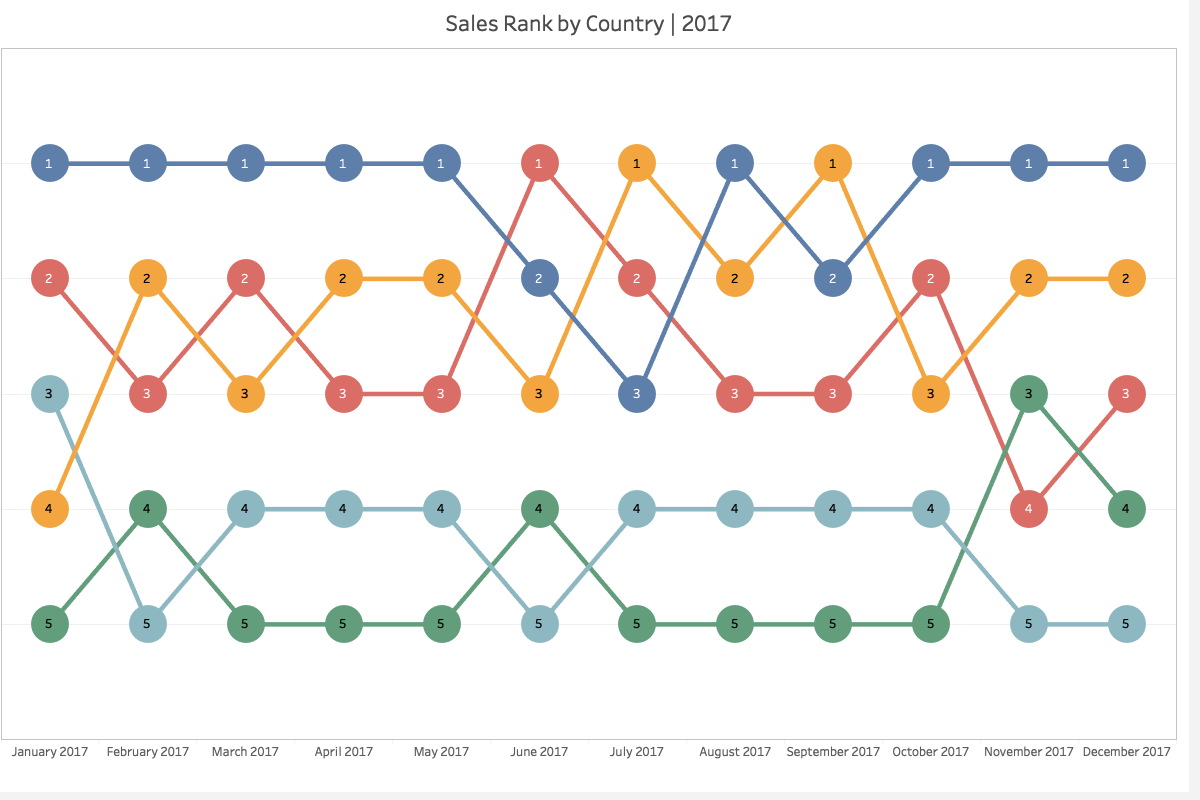
Bump charts / Slope charts are an interesting way to show changes in rankings over time, but Power BI does not currently have a good built-in chart for this sort of visualization.

I saw an interesting example of one of these charts recently where the circles in the bump chart also change size based on the relative value of the metric.
There is a video on the Curbal channel showing how you can get pretty close with a line chart, but the circles are all the same size.
And Kerry Kolosko also has an example using deneb on her site. And while the circles are a constant size in her example, I was pretty sure that with a little tweaking I could make Deneb produce the sort of output I wanted.
I started using a copy of the data set from Curbal’s video. I used the existing [Rank bump chart] measure for the rankings and I created a simple Percent of Year measure using the following expression for the labels and sizing of the circles.
Percent of Year = DIVIDE([Sales], CALCULATE([Sales] , all(), values('Calendar'[Year])))And after a bit of experimenting and reading through the Vega and Vega-Lite documentation to figure out how to specify the size encoding for the circles I ended up with the following result which I was pretty pleased with.

Below is the Deneb specification for the above chart
{
  "$schema": "https://vega.github.io/schema/vega-lite/v5.json",
  "usermeta": {
    "deneb": {
      "build": "1.4.0.0",
      "metaVersion": 1,
      "provider": "vegaLite",
      "providerVersion": "5.4.0"
    },
    "interactivity": {
      "tooltip": true,
      "contextMenu": true,
      "selection": false,
      "highlight": false,
      "dataPointLimit": 50
    },
    "information": {
      "name": "Bump Chart",
      "description": "[No Description Provided]",
      "author": "Darren Gosbell",
      "uuid": "3416d242-19c2-4c88-b369-63d3f8ca302e",
      "generated": "2022-12-09T07:05:41.633Z"
    },
    "dataset": [
      {
        "key": "__0__",
        "name": "Year",
        "description": "This is the column for the X-Axis",
        "type": "numeric",
        "kind": "column"
      },
      {
        "key": "__1__",
        "name": "CategoryName",
        "description": "This is the column for the Y-Axis",
        "type": "text",
        "kind": "column"
      },
      {
        "key": "__2__",
        "name": "Rank bump chart",
        "description": "This is the ranking measure",
        "type": "numeric",
        "kind": "measure"
      },
      {
        "key": "__3__",
        "name": "Percent of Year",
        "description": "This is the value to display",
        "type": "numeric",
        "kind": "measure"
      }
    ]
  },
  "config": {
    "view": {"stroke": "transparent"},
    "font": "Segoe UI",
    "arc": {},
    "area": {
      "line": true,
      "opacity": 0.6
    },
    "bar": {},
    "line": {
      "strokeWidth": 3,
      "strokeCap": "round",
      "strokeJoin": "round"
    },
    "path": {},
    "point": {
      "filled": true,
      "size": 75
    },
    "rect": {},
    "shape": {},
    "symbol": {
      "strokeWidth": 1.5,
      "size": 50
    },
    "text": {
      "font": "Segoe UI",
      "fontSize": 12,
      "fill": "#666666"
    },
    "axis": {
      "ticks": false,
      "grid": false,
      "domain": false,
      "labelColor": "#666666",
      "labelFontSize": 12,
      "titleFont": "wf_standard-font, helvetica, arial, sans-serif",
      "titleColor": "#070f25",
      "titleFontSize": 16,
      "titleFontWeight": "normal"
    },
    "axisQuantitative": {
      "tickCount": 3,
      "grid": true,
      "gridColor": "#C8C8C8",
      "gridDash": [1, 5],
      "labelFlush": false
    },
    "axisX": {"labelPadding": 5},
    "axisY": {"labelPadding": 10},
    "header": {
      "titleFont": "wf_standard-font, helvetica, arial, sans-serif",
      "titleFontSize": 16,
      "titleColor": "#070f25",
      "labelFont": "Segoe UI",
      "labelFontSize": 13.333333333333332,
      "labelColor": "#666666"
    },
    "legend": {
      "titleFont": "Segoe UI",
      "titleFontWeight": "bold",
      "titleColor": "#666666",
      "labelFont": "Segoe UI",
      "labelFontSize": 13.333333333333332,
      "labelColor": "#666666",
      "symbolType": "circle",
      "symbolSize": 75
    }
  },
  "data": {"name": "dataset"},
  "encoding": {
    "x": {
      "field": "__0__",
      "type": "nominal"
    },
    "y": {
      "field": "__2__",
      "type": "nominal",
      "axis": null
    },
    "order": {
      "field": "__0__",
      "type": "nominal"
    }
  },
  "layer": [
    {
      "name": "Lines Layer",
      "mark": {
        "type": "line",
        "point": false,
        "interpolate": "monotone"
      },
      "encoding": {
        "color": {
          "field": "__1__",
          "legend": false,
          "scale": {
            "scheme": "pbiColorNominal"
          }
        }
      }
    },
    {
      "name": "Circle Layer",
      "mark": {
        "type": "circle",
        "tooltip": true,
        "opacity": 1
      },
      "encoding": {
        "color": {
          "field": "__1__",
          "legend": false
        },
        "size": {
          "field": "__3__",
          "type": "quantitative",
          "scale": {
            "range": [200, 2000]
          },
          "legend": null
        }
      }
    },
    {
      "mark": {
        "type": "text",
        "color": "white"
      },
      "encoding": {
        "text": {
          "field": "__3__",
          "format": "0%",
          "formatType": "pbiFormat"
        }
      }
    },
    {
      "transform": [
        {
          "window": [
            {"op": "rank", "as": "rank"}
          ],
          "sort": [
            {
              "field": "__0__",
              "order": "descending"
            }
          ]
        },
        {"filter": "datum.rank === 1"}
      ],
      "mark": {
        "type": "text",
        "align": "left",
        "baseline": "middle",
        "dx": 25,
        "fontWeight": "bold",
        "fontSize": 12
      },
      "encoding": {
        "text": {
          "field": "__1__",
          "type": "nominal"
        },
        "color": {
          "field": "__1__",
          "scale": {
            "scheme": "pbiColorNominal"
          },
          "legend": false
        }
      }
    },
    {
      "transform": [
        {
          "window": [
            {"op": "rank", "as": "rank"}
          ],
          "sort": [
            {
              "field": "__0__",
              "order": "ascending"
            }
          ]
        },
        {"filter": "datum.rank === 1"}
      ],
      "mark": {
        "type": "text",
        "align": "right",
        "baseline": "middle",
        "dx": -25,
        "fontWeight": "bold",
        "fontSize": 12
      },
      "encoding": {
        "text": {
          "field": "__1__",
          "type": "nominal"
        },
        "color": {
          "field": "__1__",
          "scale": {
            "scheme": "pbiColorNominal"
          },
          "legend": false
        }
      }
    }
  ]
}
If you prefer the look of the straight lines between the data points you can simply remove the "interpolate": "monotone" from the lines layer and you end up with a chart like the following one.

Recent Comments